


Relative Strength Index Price Action Talking Points
- This article is an extension of The Price Action Playbook, in which we looked at a full strategy utilizing price action
- The strategy discussed in this article is a simple way for traders to begin using price action in their analysis
- In this strategy, traders can look to RSI for entry triggers; but other oscillators such as Stochastics or CCI can be used as well.
Technical Analysis can bring considerable value to traders. While fundamentals and news announcements might help shape the future, the uncertainty of such factors makes speculating on them alone a daunting prospect.
Namely – not only do you not know how any given ‘event’ or ‘data announcement’ might come out – but you also have no clue how the market is going to price that event. So even if you did know the NFP number an hour or a day beforehand, you can’t be certain for how the market will price that in.
Technical Analysis, on the other hand, will allow a trader to see how the market has priced an asset in the recent past. Technical Analysis will help traders see where trends have developed, and what biases may exist in the market. But within the realm of technical analysis, there are many different ways to approach the market; and many new traders will often struggle with the nuances of such decisions as they look to build their approach.
At DailyFX, we talk about price action quite a bit. This is one of the most ‘clean’ ways that traders can analyze the market since no indicators are being used. A wise man once said that any indicator is really just a ‘fancy moving average.’ This makes sense because most technical indicators simply look at past price information to input into that information a mathematical function to derive a value. Since price action uses no mathematical function, and looks directly at price itself – the trader is getting the most clear and accurate depiction of what’s recently taken place on the chart.
One of the more difficult aspects of price action is that it often takes time to learn; and further – even after learned it’s a subjective form of analysis that leaves a lot up to decide by the trader.
In this article, we’re going to do our best to simplify this approach by including an indicator for the entry trigger into the position; leaving price action to perform the big picture analyses for the setup.
Using Price Action to Grade Trends
The trader’s conundrum is that their job is to trade the future despite the fact that no human being can actually ‘tell’ the future. This means that losing trades are an inevitable part of speculation.
This is why price action can be so valuable: It can allow traders to notice what’s happened in the recent past so that they can decide whether or not they think those trends or biases can continue.
We discussed this concept in-depth in the article, Using Price Action to Trade Trends. By noticing where biases in the market may have taken place in the recent past, traders can look to trade in the direction of that trend.
Price Action can help traders accurately grade trends
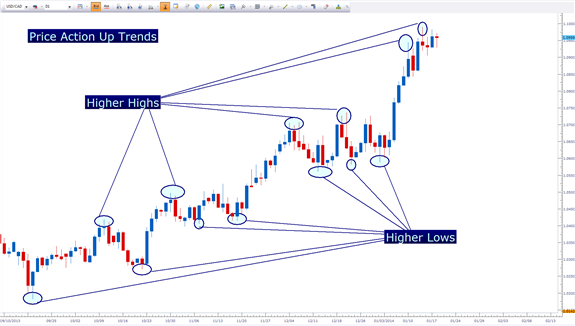
Created by James Stanley
If the trader is seeing a series of ‘higher-highs’ and ‘higher-lows,’ then the trader will often look to go long in anticipation of the up-trend coming back to order. And vice versa to the down side; if traders are seeing a series of ‘lower-lows’ and ‘lower-highs,’ they will often look to initiate short positions so that if the observed down-trend continues in the market, they can potentially see profitable positions.
Further, this can allow the trader to look to buy up-trends cheaply (or to sell down-trends expensively); so that if the trend doesn’t continue, the trader can look to bail out of the position with a minimum of a loss… but if the trend does continue the trader can look for two, three, or four times their risk amount. This is a clear and concise path to avoid The Number One Mistake that Forex Traders Make.
After the trader has diagnosed the trend, they can begin plotting their entry into the position; and below we will show you how this can be done using one of the more popular indicators out there.
Triggering a Position with RSI
In my experience, grading or diagnosing trends via price action can be easily learned by traders: It’s the entry that often causes confusion.
We did our best to show an entry trigger based on price action in the article, The Price Action Trigger, and further we showed you how this can be done in concert of a ‘bigger picture approach’ in The Price Action Playbook; but this isn’t the only way of initiating trades, as indicators can also be used to trigger entries.
The Relative Strength Index is probably one of the more popular and effective indicators available to traders. We discussed various ways of using this versatile indicator in the article, Three Methods for Trading RSI. It’s often one of the first indicators learned, and in many cases one of the first indicators abandoned when traders learn that RSI (like any other indicator) doesn’t work 100% of the time.
Our goal here isn’t to find a holy grail, because when it comes to trading there is no ‘magic bullet.’
Instead, we just want a way to look to buy when the original up-trend (or down-trend) maybe coming back into the market.
After diagnosing the trend via price action (and deciding whether the trader wants to be looking at long or short positions based on the current trend); the trader can dial down to a shorter time frame for the entry into the position. We discussed some popular time frames that traders will utilize when grading trends and plotting entries in the article, The Time Frames of Trading.
If the trader is grading the trend via price action on the daily chart, they’ll often look to the 4-hour chart for entries…. Or if using the 4-hour chart to grade trends, the hourly chart will be a common time frame to enter positions.
Traders can use a shorter time frame for entry into a position

Taken from The Time Frames of Trading
Once on the shorter time frame (or the ‘entry chart’), the trader simply needs to wait for the proper signal from RSI.
If the trader has diagnosed the trend as being ‘up,’ then they can look to initiate the long position when RSI crosses up and over 30 on the ‘entry chart.’ The premise of the strategy is that while the longer-term chart has shown an up-trend, the shorter-term chart has seen a retracement that allowed prices to become ‘oversold.’ As RSI moves up and over 30, the trader looks to enter a long position with the expectation that the longer term trend is coming back, and the shorter-term retracement is coming to an end.
RSI as an Entry Trigger
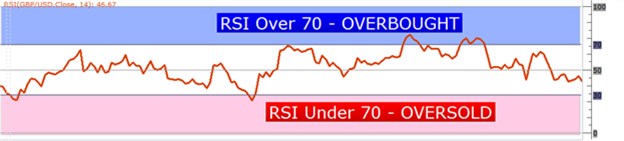
Taken from the article, Three Methods for Trading RSI
-- Written by James Stanley
James is available on Twitter @JStanleyFX
Would you like to enhance your FX Education? DailyFX has recently launched DailyFX University; which is available to any and all traders!


