
GOLD PRICES FORECAST:
- Gold prices slide on Monday amid market anxiety ahead of high-impact events in the coming days
- The center of attention will be the U.S. inflation report and the Fed’s interest rate decision this week
- This article looks at key XAU/USD’s tech levels to watch in the near term

Most Read: Oil Continues its Post-OPEC+ Slide, Multi-Week Lows in Sight
Gold prices (XAU/USD) were subdued on Monday, down about 0.3% to $1,970, pressured by a moderate rise in U.S. Treasury yields and market caution ahead of two high-impact events on the U.S. economic calendar this week: the latest consumer price index report on Tuesday and the Federal Reserve’s interest rate announcement on Wednesday.
Focusing on the first event, May annual headline inflation is expected to drop to 4.1% from 4.9% in April, a positive development for the Fed. However, core CPI, which excludes volatile items and reflects the prevalent behavior of the long-term price level, is only seen easing to 5.3% from 5.5%, a sign that the broader trend remains sticky. Persistently elevated inflation may compel the central bank to maintain a restrictive stance for a long stretch, creating headwinds for precious metals.
The second major market catalyst this week will be the FOMC decision. In terms of expectations, the Fed is forecast to keep interest rates at their current level of 5.00%-5.25%, but the pause could be short-lived, with policymakers resuming hiking in July in the face of resilient economic data. Due to increased uncertainty about the outlook, traders should closely monitor forward guidance as well as macroeconomic projections.

KEY US ECONOMIC EVENTS THIS WEEK
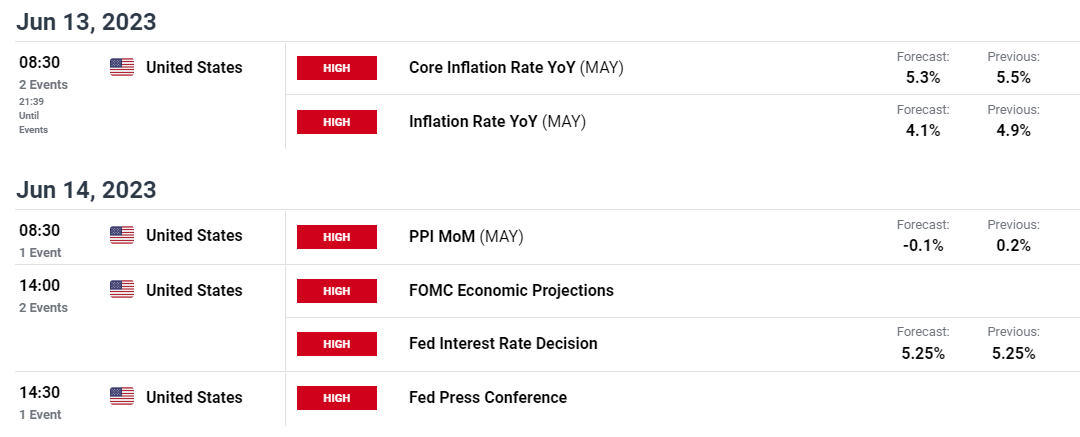
Source: DailyFX Economic Calendar
If the Fed opts to hit the pause button, the decision could be accompanied by a more hawkish tightening path. For example, the updated dot plot could incorporate one or even two additional 25-quarter-point hikes for 2023 and no easing through 2024. A higher peak rate, coupled with the possibility of no cuts next year, should keep U.S. Treasury yields skewed to the upside, boosting the U.S. dollar in the process. In this environment, gold will struggle to mount a meaningful comeback following recent softness.
| Change in | Longs | Shorts | OI |
| Daily | -1% | 0% | -1% |
| Weekly | -3% | 6% | 1% |
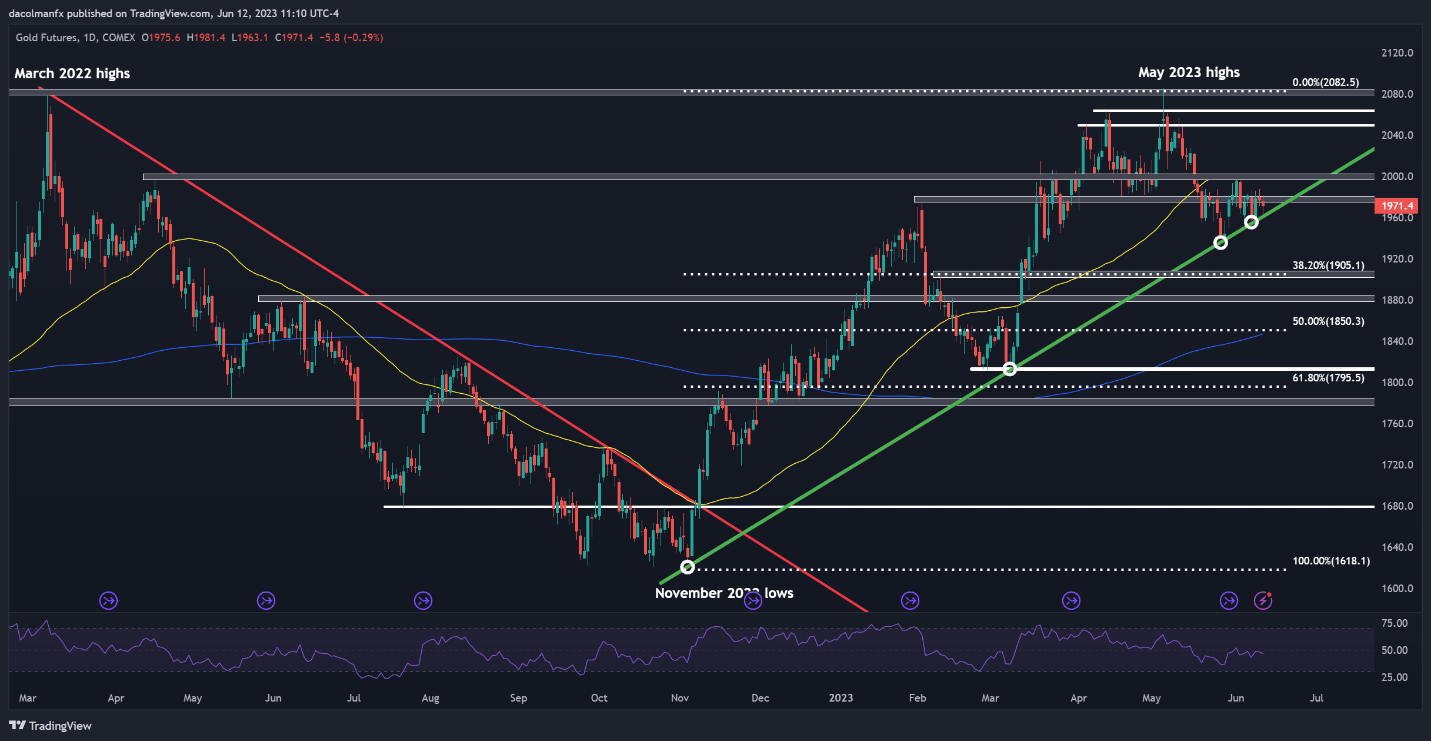
GOLD PRICES TECHNICAL ANALYSIS
Gold's recent pullback appears to be a corrective move within a medium-term uptrend, but the market bias could become bearish if prices break below the rising trendline that has been guiding the metal higher since November of 2022. Having said that, traders should keep an eye on $1,960 in the coming days.
In terms of possible scenarios, if gold futures breach $1,960, buyers could run for the hills and liquidate positions, accelerating selling pressure and paving the way for a move toward $1,905, the 38.2% Fib retracement of the Sep 2022/May 2023 advance. On further weakness, the focus shifts to $1,880.
On the other hand, if gold establishes a base around current levels and mounts a recovery, initial resistance lies at $1,980. Clearance of this ceiling may rekindle buying interest, setting the stage for a rally toward the psychological $2,000 mark.
GOLD FUTURES TECHNICAL CHART