


Oil Prices, Charts, and Analysis
- Oil slips as recession fears continue to grow.
- Oil price heads lower despite recent Saudi production cut.

The recent Saudi oil production cut of one million barrels a day has failed to stabilize the price of oil which now nears lows last seen in late March. The production cut announcement, made on Sunday, June 4 saw oil jump sharply before giving back all of its gains and more the next day. Since then, oil has continued to slide as fears continue to grow that the US may soon fall into a recession, while the hoped-for strong pick-up in Chinese economic activity is yet to be seen.
This week’s economic data and events calendar is dominated by two central bank monetary policy decisions – FOMC and ECB – and the latest look at US price pressures. The next two days will be important for oil traders.
For all market-moving events and economic data releases, see the real-time DailyFX Calendar
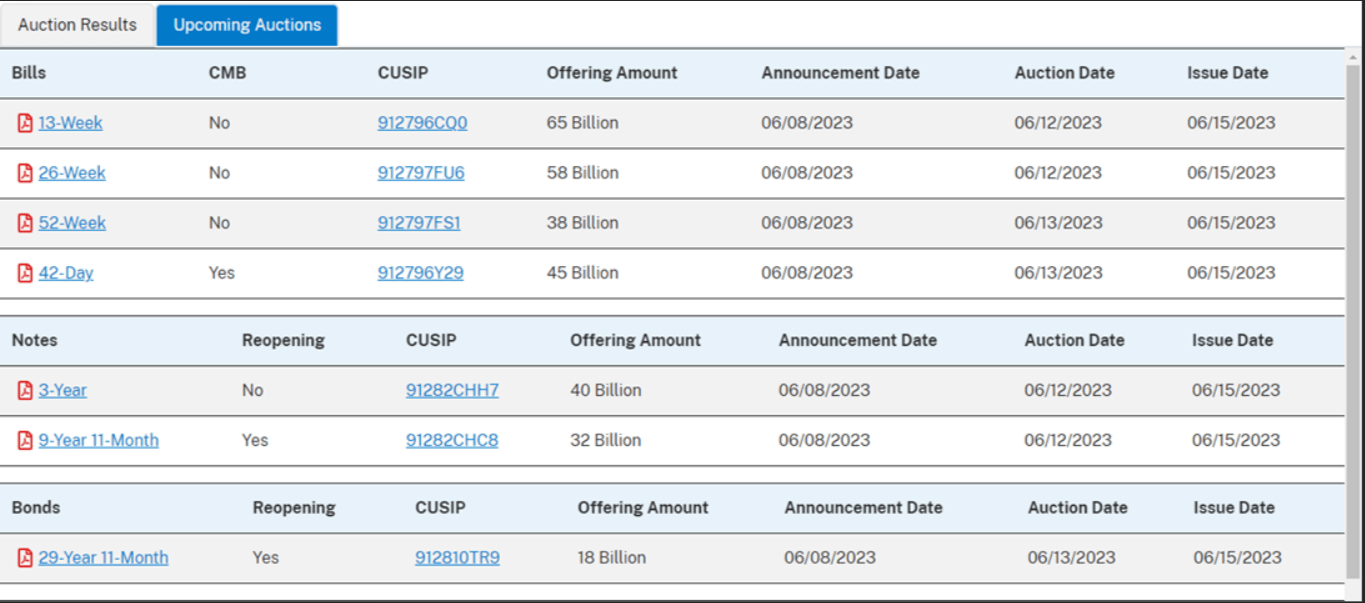
While macro-events will be closely watched, this week the US government is selling in excess of $200 billion of a mixture of bills, notes, and bonds as it starts to re-fill its current account. While a substantial amount of this will be financed by maturing paper, a chunk of new money will be required to cover this week’s sales. US yields continue to nudge higher ahead of this event and this is also keeping the price of oil in check.
Adding to the negative backdrop, investment banking giant Goldman Sachs cut their forecast for Brent crude from $95/bbl to $86/bbl. At the start of the year, Goldman forecast oil at $100/bbl.
Brent is around 2.5% lower on the session and within a couple of percentage points of posting a new multi-week low. The CCI indicator shows that oil is sitting in oversold territory, while all three moving averages are lined up in a bearish pattern. Recent lows at $71.40/bbl. and $70.17/bbl. may come under pressure unless sentiment changes.
Brent Oil Daily Price Chart – June 12, 2023
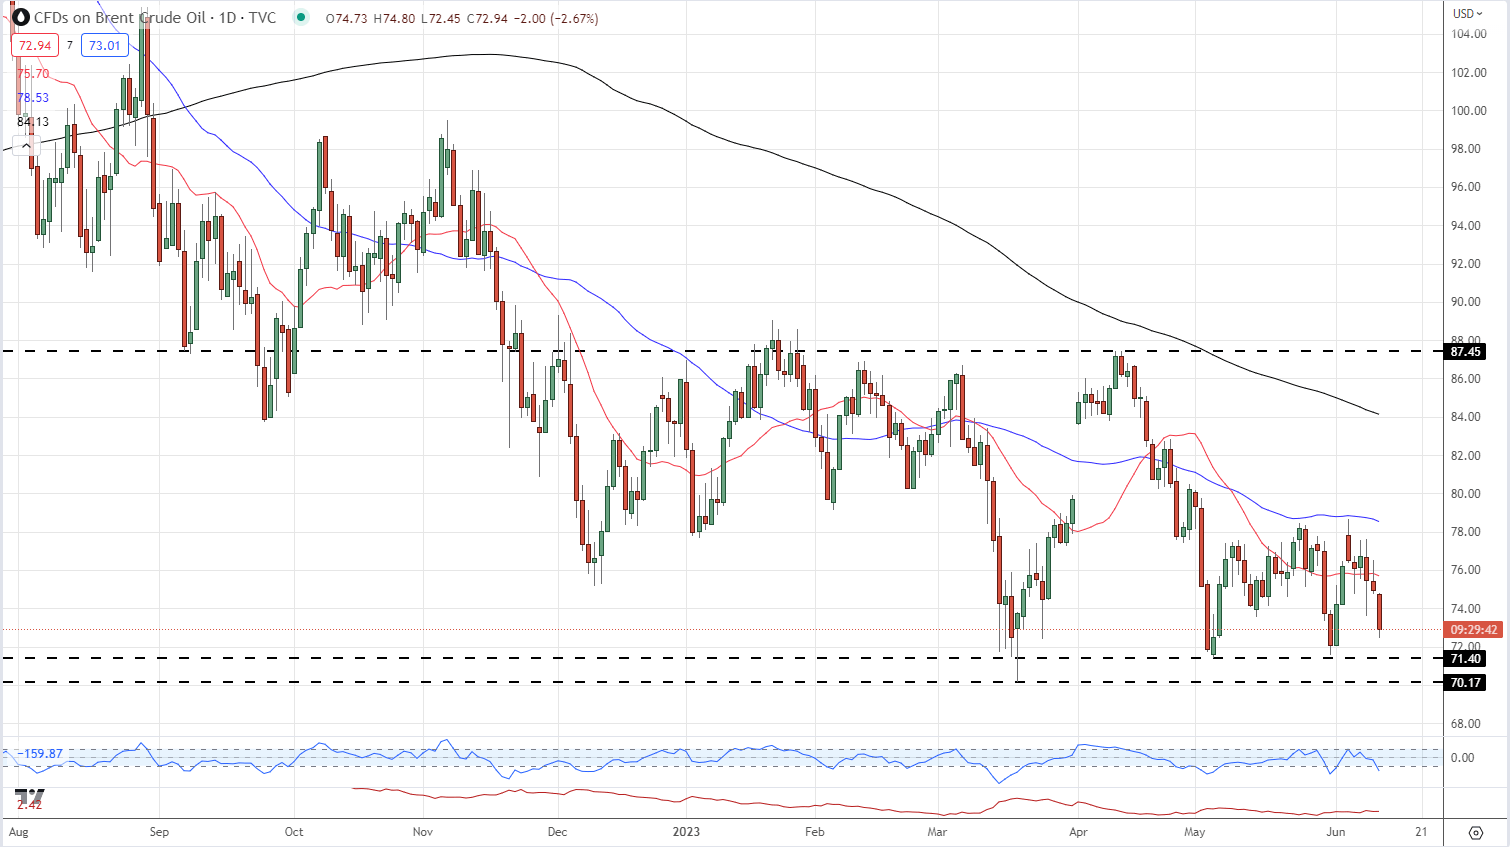
Chart via TradingView
Trade Smarter - Sign up for the DailyFX Newsletter
Receive timely and compelling market commentary from the DailyFX team
Retail Traders are Net-Long US Crude Oil
Retail trader data shows 85.78% of traders are net-long US Crude with the ratio of traders long to short at 6.03 to 1.The number of traders net-long is 6.36% higher than yesterday and 8.56% higher from last week, while the number of traders net-short is 3.12% lower than yesterday and 24.87% lower from last week.
We typically take a contrarian view to crowd sentiment, and the fact traders are net-long suggestsOil- US Crude prices may continue to fall. Traders are further net-long than yesterday and last week, and the combination of current sentiment and recent changes gives us a stronger Oil - US Crude-bearish contrarian trading bias.
What is your view on the Oil – bullish or bearish?? You can let us know via the form at the end of this piece or you can contact the author via Twitter @nickcawley1.


