GOLD PRICES FORECAST:
- Gold prices were subdued on Wednesday after Fed chair Powell indicated that the central bank plans on hiking two more times this year
- Taking into account recent weakness, the precious metal has fallen more than 2.5% in June, approaching its lowest level since March 15
- This article looks at XAU/USD’s key tech levels to watch in the coming days

Most Read: US Dollar Shines Bright on Powell’s Hawkish Stance, Key Tech Levels to Watch
Gold prices were subdued on Wednesday, pressured by U.S. dollar strength following hawkish comments by Jerome Powell at a central banking forum hosted by the ECB. In late afternoon trading, XAU/USD was sliding about 0.15% to $1,910, steadily approaching its lowest level since March 15 and on track to close the month down more than 2.5%.
At a panel in Sintra, the FOMC chief noted that the bank's policy-setting may not be sufficiently restrictive, stressing that a majority of Fed officials support raising borrowing costs two more times in 2023. Although traders are somewhat skeptical of the possibility of 50 bp of additional tightening this year, this scenario should not be dismissed out of hand.
The U.S. economy has held up remarkably well so far, so traders should not underestimate its resilience. That said, if incoming data continues to surprise on the upside, policymakers will have no choice but to press ahead with their plans to push the terminal rate to a more constrictive level as part of the ongoing fight to defeat sticky inflationary pressures.

Related: Gold Price Forecast - XAU/USD Breakdown Levels Identified
The possibility of the peak rate drifting higher, coupled with the view that monetary policy will remain tight for longer, should keep nominal and real yields pointing higher for now, weighing on precious metals in the near term. While the outlook may change if the U.S. economy takes a turn for the worse, there is no indication that this will happen imminently.
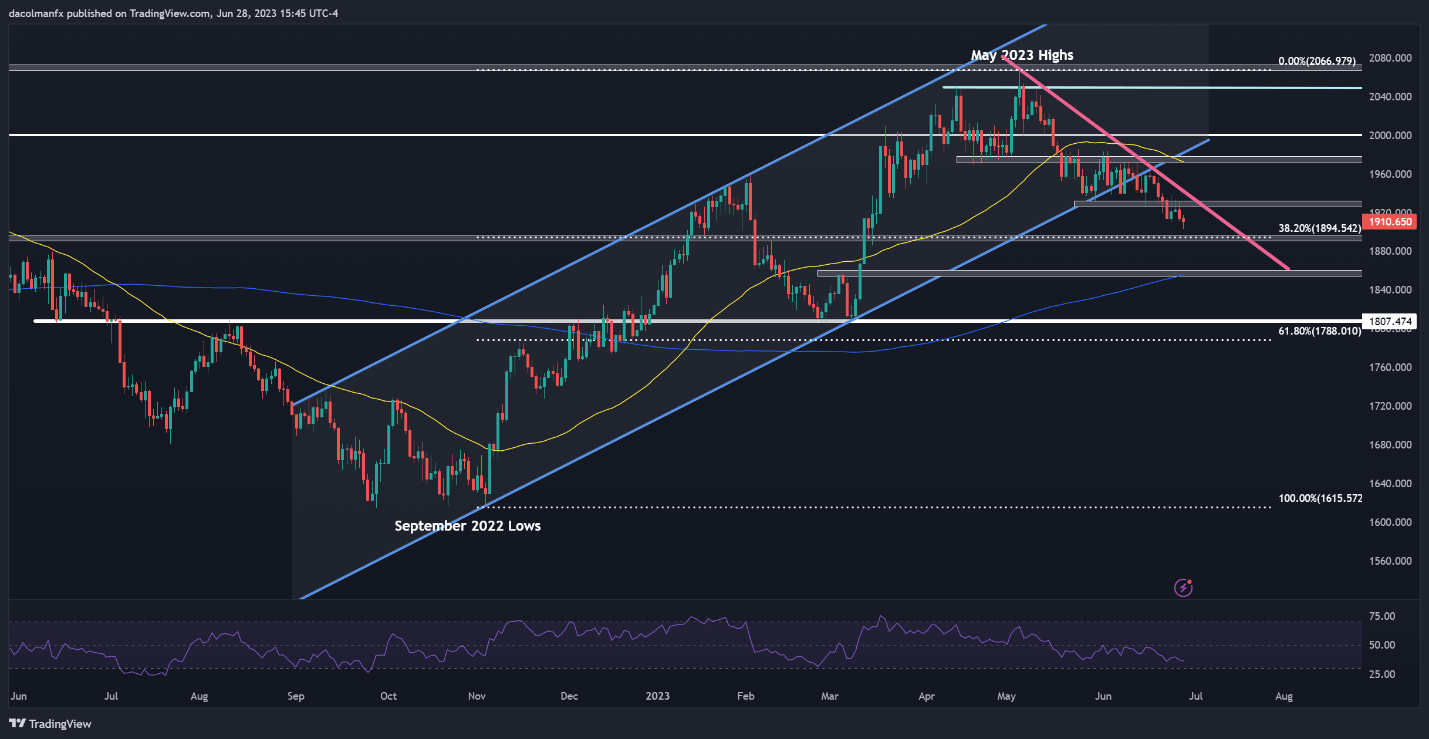
In terms of technical analysis, gold appears to be heading toward an important support near $1,895, defined by the 38.2% Fibonacci retracement of the Sept 2022 lows/May 2023 highs. Traders should carefully watch this zone, as a breakdown accelerate selling momentum, paving the way for a possible retest of the 200-day simple moving average at $1,855.
On the flip side, if buyers return to the market and spark a rebound, initial resistance stretches from $1,925/$1,930. If this barrier is taken out, we could see a move toward $1,970, near the 50-day simple moving average. On further strength, the focus shifts to the psychological $2,000 level.
| Change in | Longs | Shorts | OI |
| Daily | -5% | 2% | -2% |
| Weekly | -5% | 14% | 3% |
GOLD PRICES TECHNICAL CHART