


GOLD AND SILVER PRICES OUTLOOK
- Gold prices plunge as Powell opens the door to a higher peak rate and a bigger hike for the next FOMC meeting
- Silver plummets more than 4%, reaching its lowest level since November 2022
- Precious metals are likely to retain a negative bias in the near term amid a hawkish repricing of the Fed’s policy outlook

Most Read: US Dollar Rallies as Powell Issues Hawkish Pledge, Signals Higher Peak Rates
Gold prices (XAU/USD) plunged on Tuesday, falling nearly 2% below the $1,820 threshold, after Fed’s chair Powell embraced a hawkish stance at a Congressional hearing, indicating that the FOMC’s terminal rate is likely to settle higher than initially anticipated in response to sticky inflation. Silver (XAG/USD) also took a beating, plummeting more than 4% to $20.15, its lowest level since November 2022, a bearish move that was reinforced by the U.S. dollar surge in the FX space.
Powell admitted that inflation has not come down as fast as policymakers had hoped and that tight labor markets are exacerbating price pressures in the economy, complicating the Federal Reserve's fight. The central bank chief also acknowledged that the institution is prepared to accelerate the pace of hikes if necessary, although he cautioned that future actions will be guided by the totality of incoming data.
FED FUNDS FUTURES, GOLD AND SILVER CHART
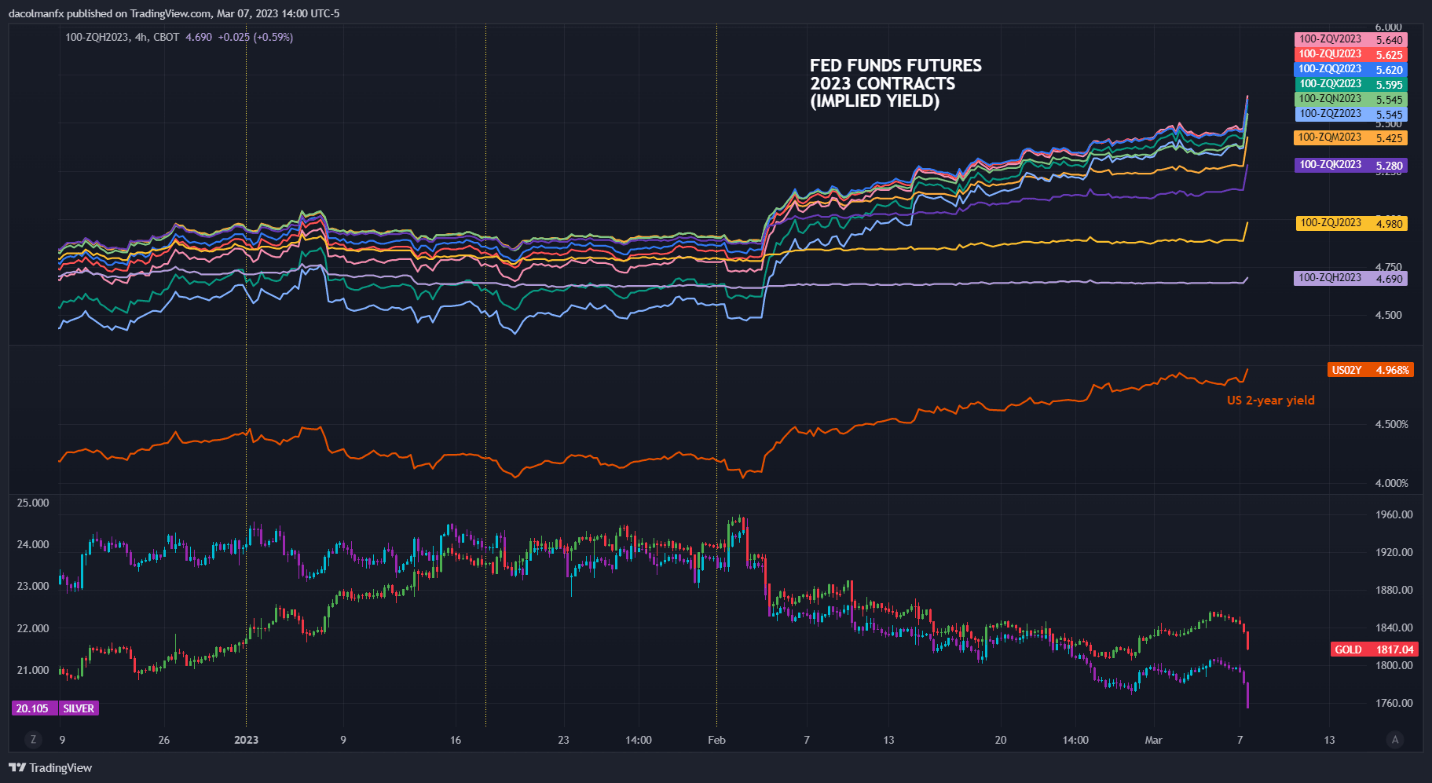
Powell’s remarks sparked a hawkish repricing of the monetary policy outlook, prompting expectations for borrowing costs to drift sharply higher, with Fed funds futures now implying a terminal rate of 5.640% versus 5.435% one week ago. This is obviously a negative development for rate-sensitive assets.
Tuesday's event also led traders to discount with greater conviction the likelihood of a 50 basis point interest rate hike at the March FOMC meeting, raising the probability of that scenario to 69% at the time of writing (see chart below). There is room for those expectations to firm if economic strength continues, so gold and silver will remain in a vulnerable place for now.

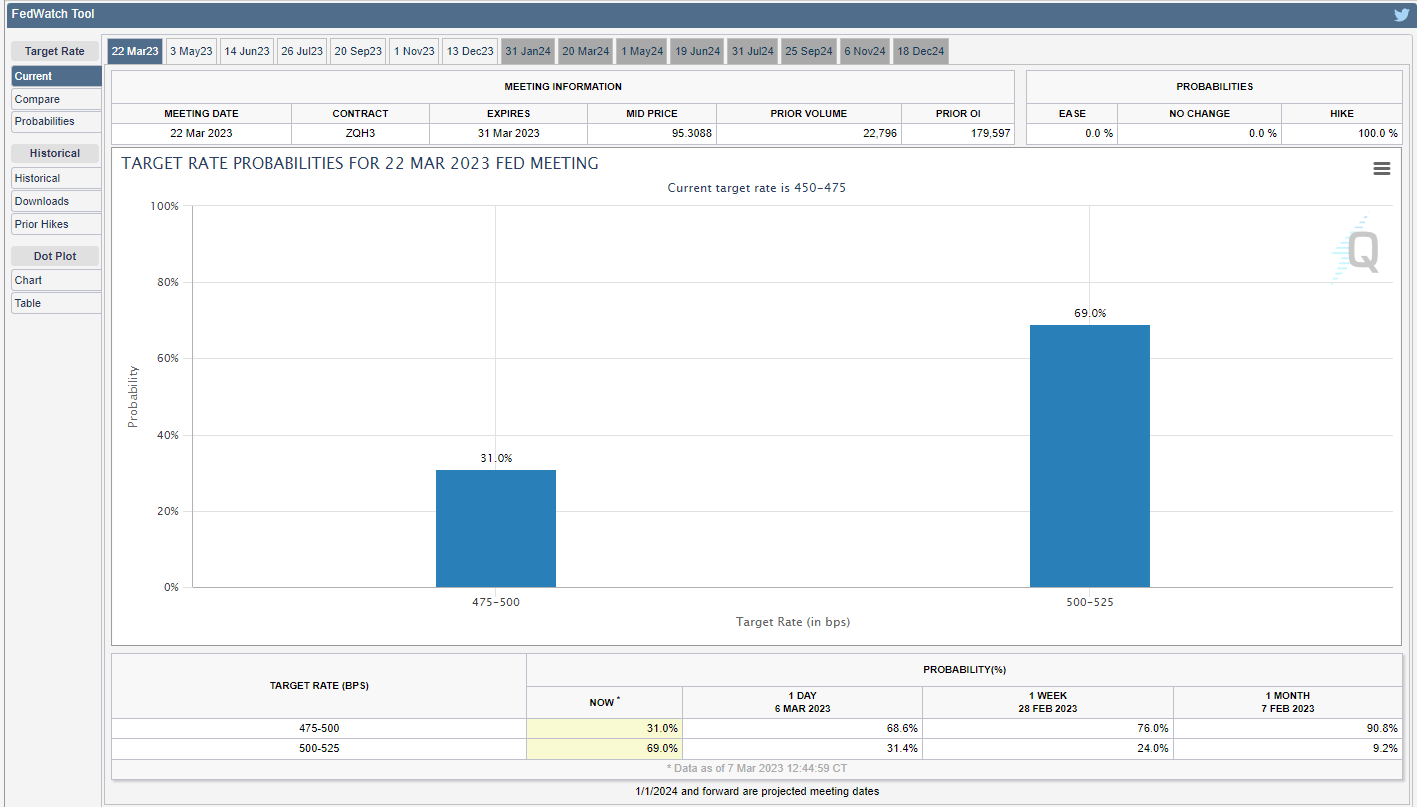
Source: FedWatch Tool
To better position for what lies ahead, traders should keep an eye on the calendar over the next few days. There are several key releases this week, but the February nonfarm payrolls report may be the most important one in shaping the debate over the Fed's next steps. Consensus estimates indicate that U.S. employers added 203,000 workers last month, but the strong rise in the ISM services employment index and low jobless claims suggest we could be in for an upside surprise.
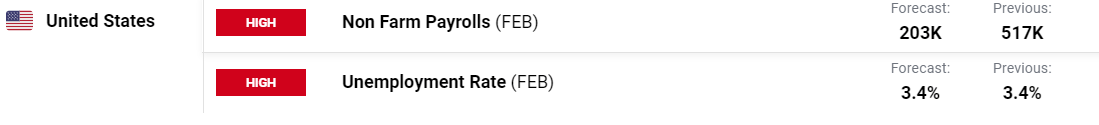
Source: DailyFX Economic Calendar
| Change in | Longs | Shorts | OI |
| Daily | 1% | -3% | -1% |
| Weekly | 2% | -8% | -2% |
GOLD PRICE TECHNICAL ANALYSIS
After Tuesday’s selloff, gold prices are quickly approaching a significant technical support level near $1,810, corresponding to the February’s low. If XAU/USD breaks down and falls below this floor, sellers could launch an attack on the 200-day simple moving average hovering around the $1,785 level. On the flip side, if buyers resurface and trigger a rebound, initial resistance is seen at $1,840, followed by $1,860.
GOLD TECHNICAL CHART
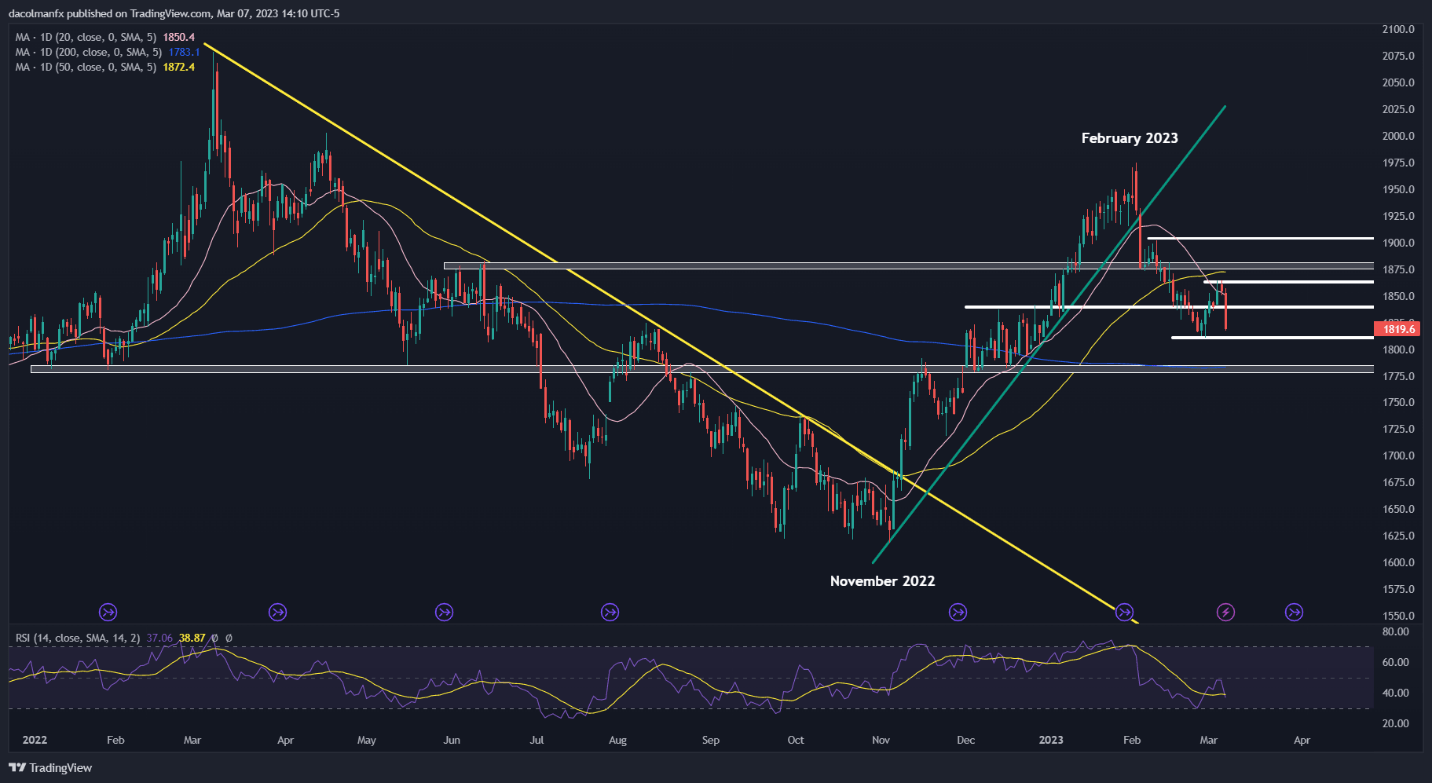
Gold Futures Chart Prepared Using TradingView
Written by Diego Colman, Contributing Strategist for DailyFX


