GOLD PRICE FORECAST
- Gold prices have fallen significantly in recent weeks, dragged down by the strong recovery in U.S. yields
- Resilient U.S. economic activity and persistently high inflation argue in favor of no Fed pause in June
- This article looks at XAU/USD’s key technical levels to watch in the coming days

Most Read: US Dollar Perks Up While Gold Turns Lower Following Strong Core PCE Data
Gold prices staged a solid rally from early March through early May, coming within striking distance from setting fresh all-time highs in the wake of the financial market upheaval following the collapse of a few regional banks.
Since then, the precious metal has clawed back at least half of those gains, dragged down by the powerful recovery in U.S. Treasury rates, which has pushed real yields sharply higher, driving the 10-year TIPS near the 1.5% threshold, the best mark in nearly three months. The strength of the U.S. dollar has also weighed on bullion.
The rebound in yields can be attributed partly to economic resiliency. At the beginning of the year, Wall Street feared that the economy, buckling under the weight of overly restrictive monetary policy, would slip into a recession soon, with those concerns magnified by the banking sector turmoil.
Gold Prices (inverted scale), US Dollar Index (DXY) and US-10 Year Real Yield Chart
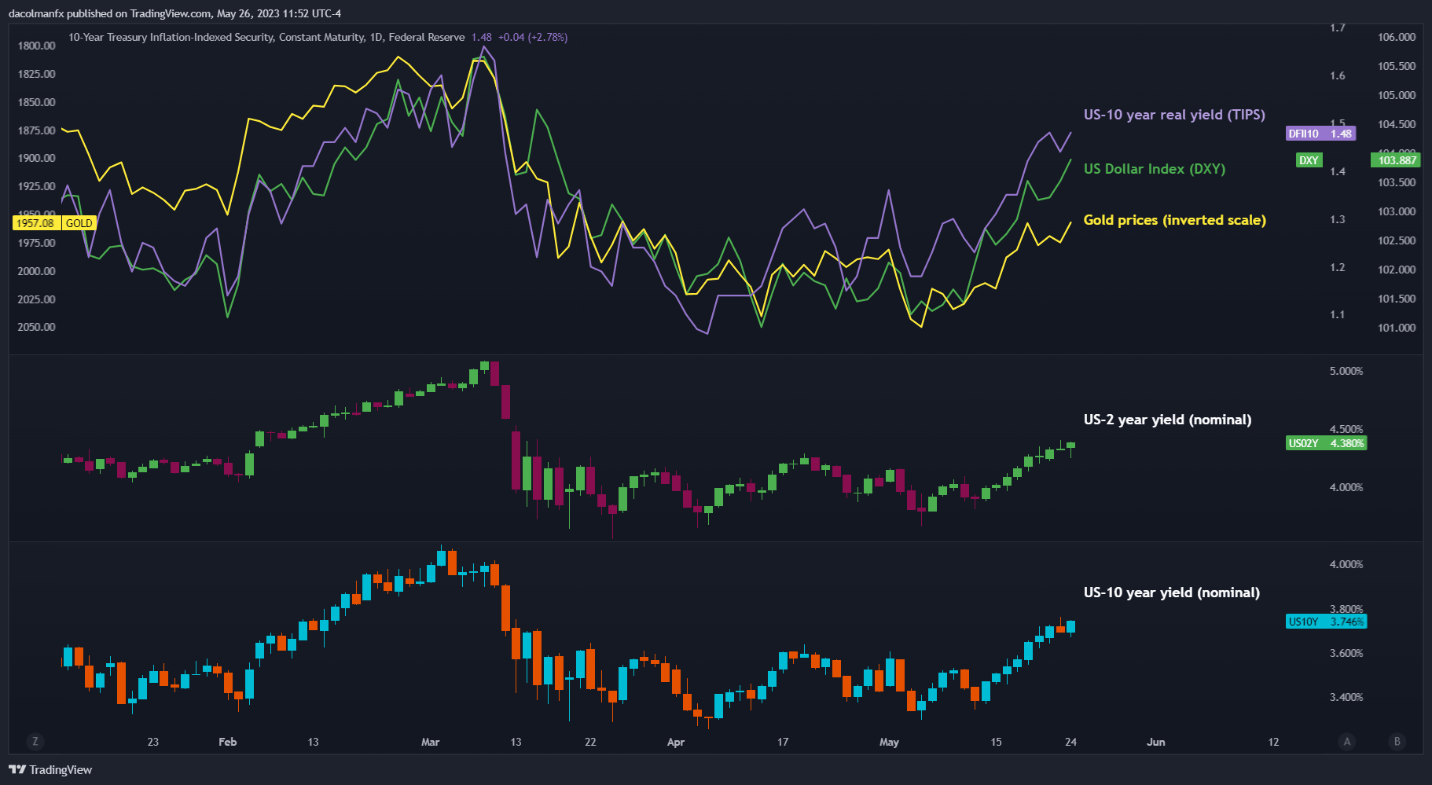
Source: TradingView
However, the performance of the U.S. economy has time and again defied downbeat projections, thanks in part to the remarkable strength of the labor market, prompting forecasters to postpone the timing of a downturn to a later date, perhaps 2024.
With U.S. business activity and American consumers holding up better than expected, inflation has also been sticky. Granted, the broader trend is heading downwards, but price pressures remain unacceptably high and biased to the upside, a sign that the hiking cycle may not yet be over. April’s core PCE data proved this point.
Although the Fed has signal it may hit the pause button at its June meeting, further tightening should not be ruled out entirely. There’s no consensus view now, but recent Fedspeak is nudging markets to lean toward another 25 bp hike for next month and higher-for-longer rates.

FedWatch Tool Probability of a Hike in June
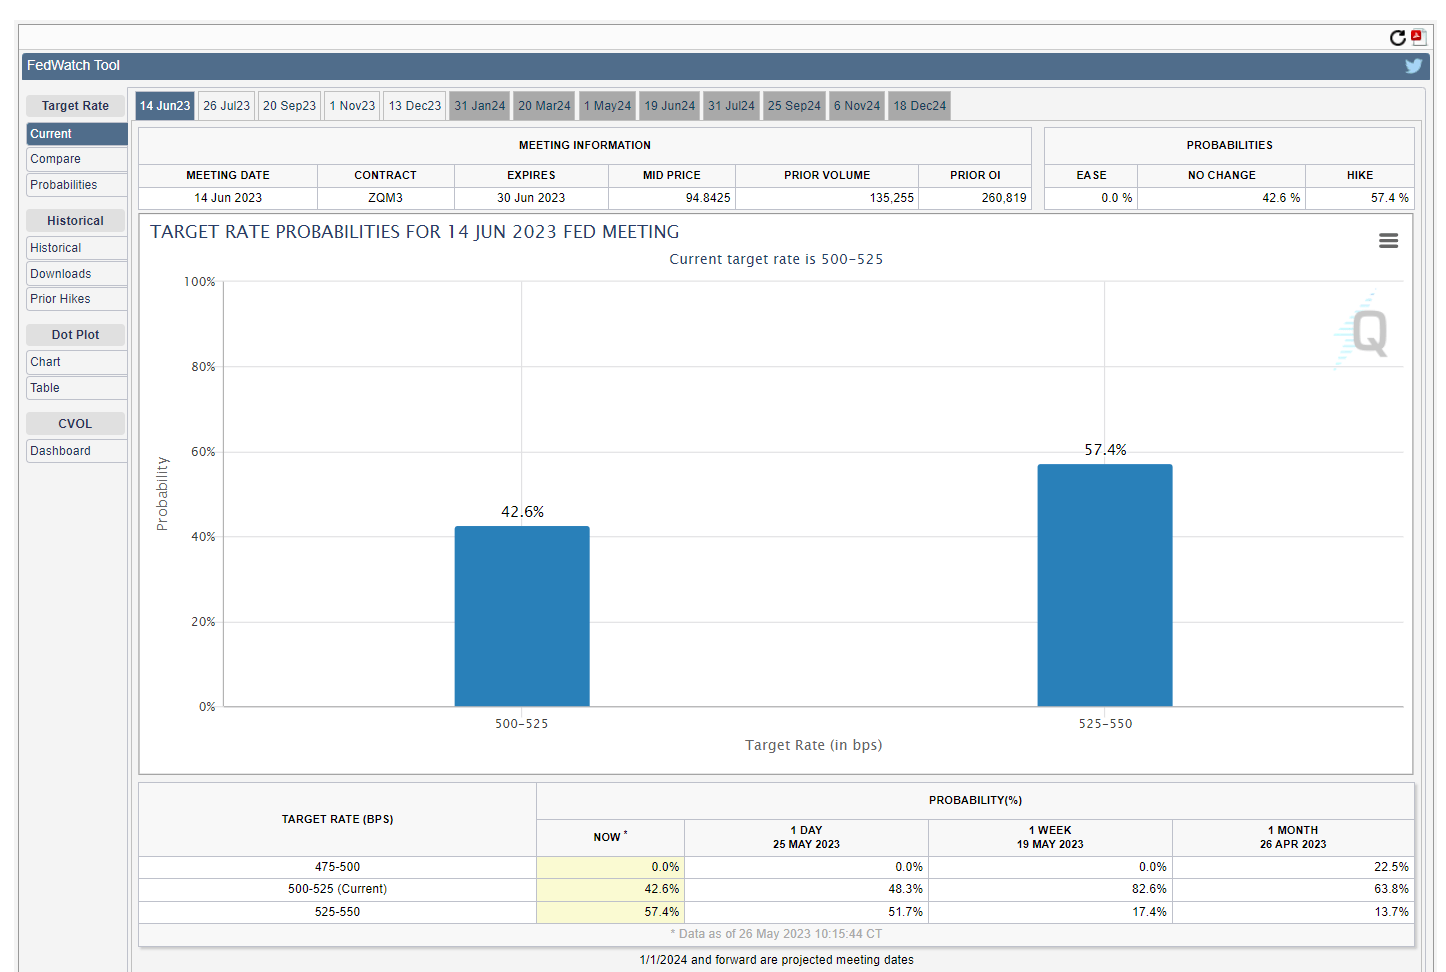
Source: CME Group
If the monetary policy outlook continues to shift in a more hawkish direction, nominal and real yields will extend their gains, boosting the U.S. dollar in the process. In this environment, gold will be in a vulnerable position and prone to more weakness.
While gold’s near-term prospects are deteriorating, the bullish trend is not completely dead and could resume later this year. The longer rates stay high, the harder it will be for the economy to stay afloat. In any case, once the economy cracks and recession is inevitable, gold could start to shine again.
| Change in | Longs | Shorts | OI |
| Daily | 0% | 5% | 2% |
| Weekly | -7% | 3% | -3% |
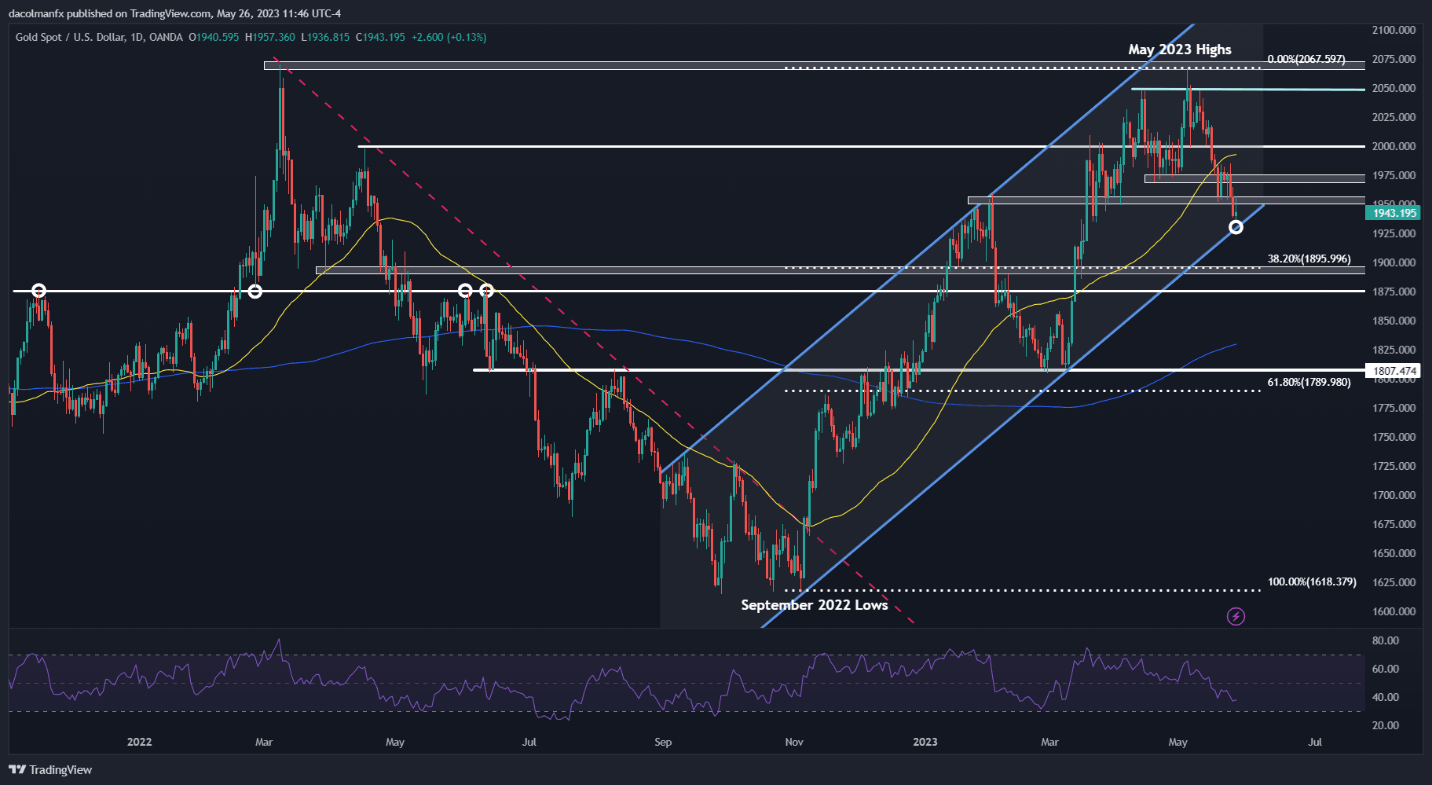
GOLD PRICES TECHNICAL ANALYSIS
Gold's recent pullback appears to be a corrective move within a medium-term uptrend. However, the overall picture could change and turn bearish if prices manage to break below channel support at $1,930. XAU/USD was slightly above this area on Friday afternoon.
In terms of possible scenarios, if gold dips further and drops beneath the $1,930 barrier, downside pressure is likely to gather pace, emboldening sellers to launch an attack on $1,895, the 38.2% Fib retracement of the Sep 2022/May 2023 rally. On further weakness, the focus would shift to $1,875.
On the flip side, if prices start to bottom out and bounce off the lower limit of the rising channel in play since late last year, initial resistance rests at $1,955, but further gains may be in store on a push above this ceiling, with the next upside target at $1,975.
GOLD PRICES TECHNICAL CHART