


S&P 500, Shanghai Composite, FXI, USDCNH, Recession and Earnings Talking Points:
- The Market Perspective: USDJPY Bearish Below 146; EURUSD Bullish Above 1.0000; Gold Bearish Below 1,680
- China markets responded abruptly to the end of the National People’s Congress and the release of 3Q GDP and important September data
- Recession is the top focus for scheduled thematic trends, but FAANG earnings, UK political changes and Japanese intervention efforts are top fundamental considerations

US Equities Offer Up a Very Different View to Risk Appetite than USDJPY
We have opened up a new trading week to some very divisive views on market perspective. From my preferred, imperfect measures of sentiment – the major US indices – Monday was presented a meaningful gain in speculative reach. The S&P 500 advanced 1.2 percent – literally half of Friday’s charge higher but an extension that helps to combat serious uncertainty in the benchmark market. Two-day rallies are not exactly common place nowadays, cementing the perception that we are in a ‘bear market bounces’ and adding weight to the importance of the confluence of the 38.2% Fibonacci retracement of the post-pandemic rally (3,935) and the 38.2% Fib retracement of the January 4th to October 13th bear wave (3,810). I do not believe a meaningful trend has taken root to start this week given that there are even greater events scheduled later this week and anticipation is generally a powerful force on market activity: either through hesitation via anticipation or an outright fundamental offset.
Chart of S&P 500 with Volume, 20 and 50-Day SMAs, Consecutive Candle Runs (Daily)
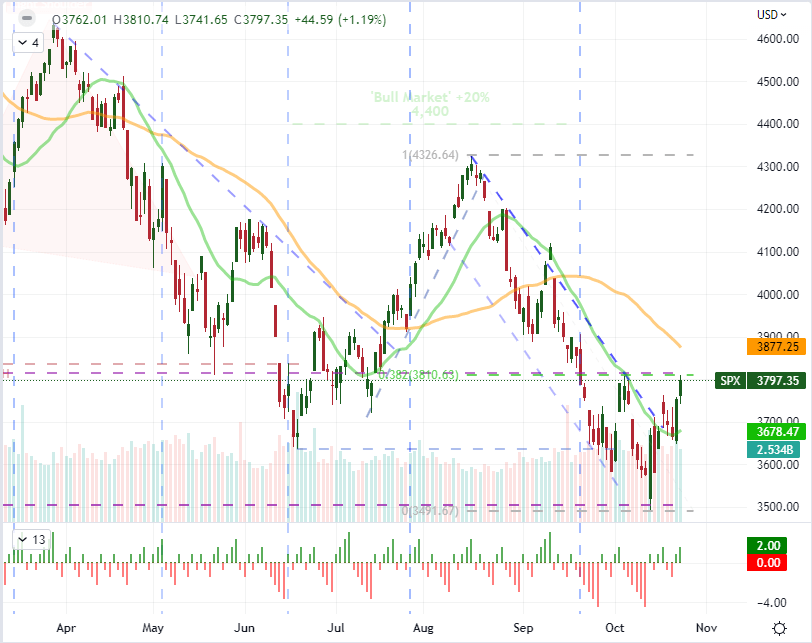
Chart Created on Tradingview Platform
While there is an a bounce in the US indices to start the week, it is worth mentioning that the relative risk perspective of the Nasdaq 100 to Dow Jones Industrial Average ratio (growth to value) stabbed down to April 2020 lows to start this week. There is serious uncertainty to draw out of the market’s price action. One point of instability that is at the top of my watch list is the performance of USDJPY. Late into this past Friday’s session, the Japanese Ministry of Finance reportedly directed the BOJ to intervene on behalf of the exchange rate to the tune of $30-37 billion. Despite the size of action, the market did not exactly run with the initial retreat. There are a number of problems at work here. Japan’s Prime Minister over the weekend suggested the government was prepared to act against speculative forces generating extreme exchange rate volatility with potentially unlimited resolve. First and foremost, the USDJPY climb has seen a notable moderation in volatility these past weeks as it has climbed. More importantly, I believe the market is being driven more by yield and financial stability than anything else. That actively contrasts the Prime Minister’s vow to combat speculative flows.

Chart of USDJPY with 20 and 100-Day SMAs, 1-day Rate of Change (Daily)
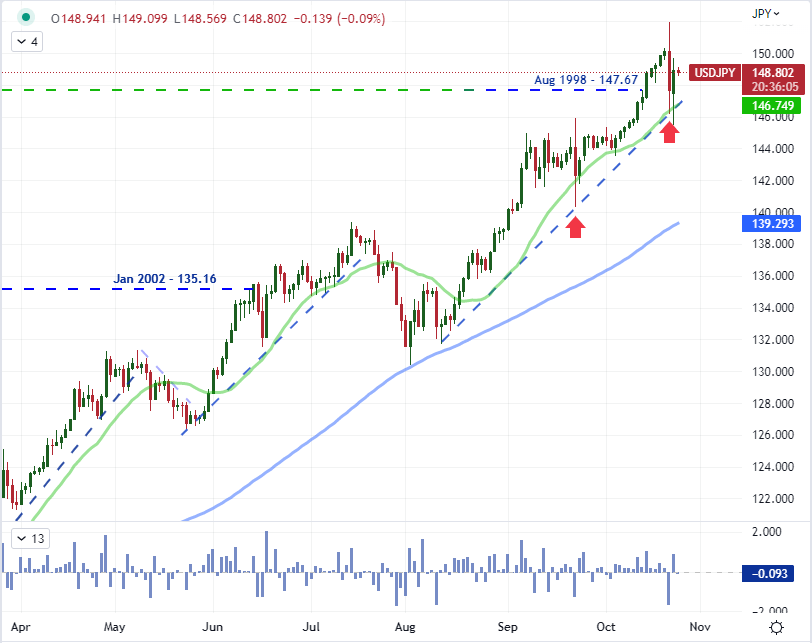
Chart Created on Tradingview Platform
China’s Systemic Position Vs Its Economic Updates
Speaking of speculative flows, the Chinese markets were back online Monday after a virtual market shuttering that observed the National People’s Congress. The top political gathering of the second largest economy is no trifle. There were a few remarkable headlines to start this week that included a question in economic data and a reference to trade wars. USDCNH advanced 1.5 percent (the biggest one-day rally since August 2015) to its highest levels since the start of 2008. It may be that authorities are ‘allowing’ the climb to bleed off further international sanction volatility, but I don’t consider China’s how to be in order.
Chart of USDCNH with 20-Day SMA Overlaid with the Shanghai-Dow Ratio (Daily)
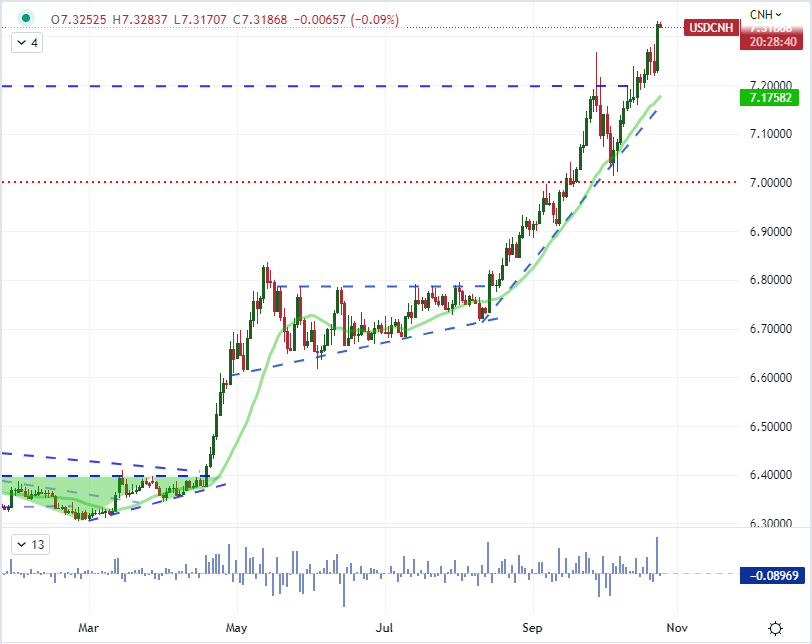
Chart Created on Tradingview Platform
Just how problematic is China’s course in shaping global financial stability? Look no further than the capital measures that track the country’s financial health. The local Shanghai Composite dropped ‘only’ -2.0% The hit around China’s standing in the international community took a greater hit by the unexpected release of the 3Q GDP and September data. The world’s second largest economy reportedly expanded a 3.9 percent year-over-year, but the that trickle down is clearly not occurred. Meanwhile, the -14 percent drop for the Chinese Golden Dragon ETF) was a standout but it generally seems to have mor to do with the response that Chinese Xi was entering a third term contrary to recession calls.
Chart of FXI iShares China Large Cap ETF Overlaid with HXC and Shanghai Composite (Daily)
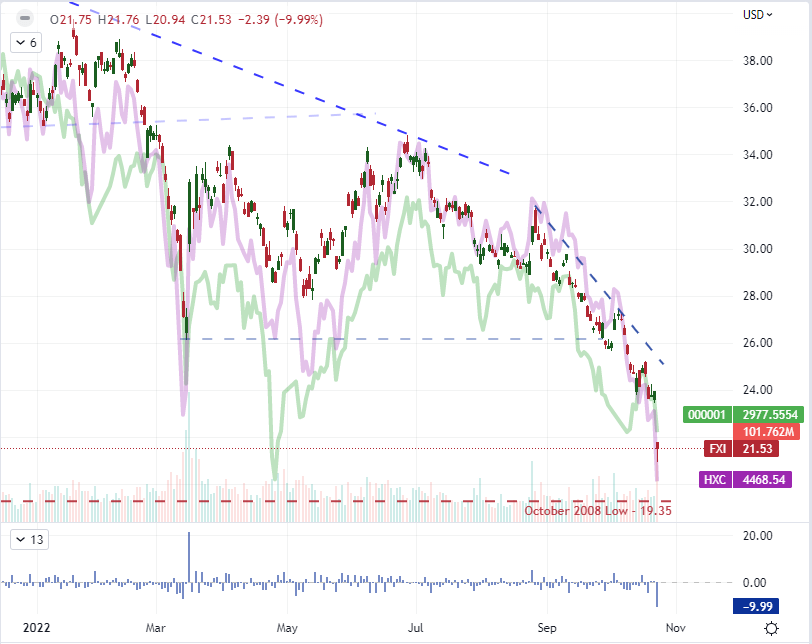
Chart Created on Tradingview Platform
Top Event Risk to Watch : Earnings, Recession Warnings and Rate Timing
As we move into the second trading day of the week, there will be a steady stream of ‘high’ importance scheduled event risk. That is the data collection that I will be focusing on for volatility and perhaps even trend development. There are a few competing themes to track for the fundamental traders, but it was the growth oriented investor that should have recognized the troubles heading into the new trading period. The October PMIs aggregated were a serious concern. The economic proxy (composite) form the US, Eurozone, UK and China all considered to operation functionally across the spectrum.
Chart of Composite PMIs of Major Developed Economies from S&P Global (Monthly)
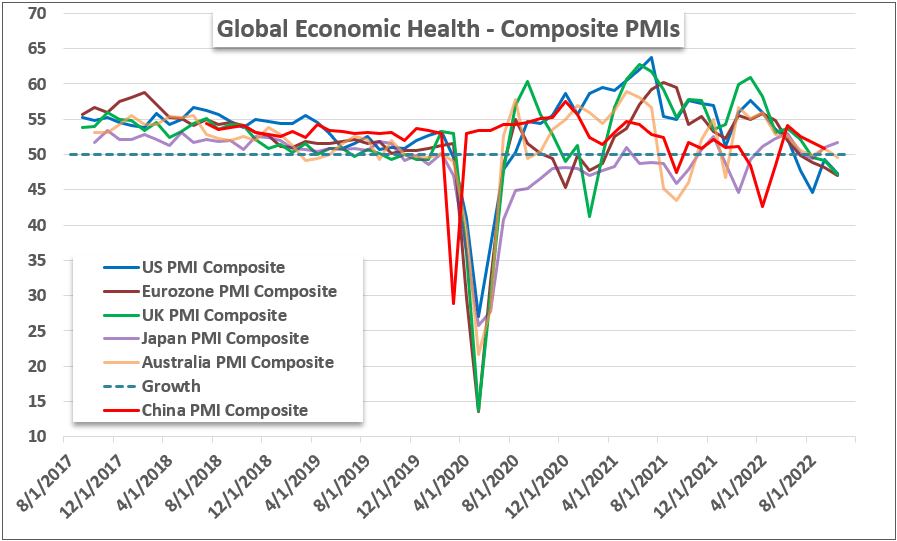
Chart Created by John Kicklighter
Growth activity and potential will be a big wind going forward thanks to that run of data on tap. The said, it seems also appropriate that that pressure is carrying the cannabis market off normally. If you are looking for fundamental influence from this broader fundamental picture, we have on the unscheduled side of things the United Kingdom’s fast announcement that Rishi Sunak as the next standing lead. More practical with time was the official October PMIs which at least tells us where we stand when attention shifts back to these perspectives.
Critical Macro Event Risk on Global Economic Calendar for Next Week

Calendar Created by John Kicklighter
Trade Smarter - Sign up for the DailyFX Newsletter
Receive timely and compelling market commentary from the DailyFX team


