


Key Points:
- US Dollar Suffers as Inflation Fell to 7.7% Vs 8% Expected.
- Markets Pricing in 85% probability of a 50bp hike from the Fed in December.
- Head and Shoulders Pattern Plays Out as USD/CAD Slides.
- To Learn More About Price Action, Chart Patterns and Moving Averages, Check out the DailyFX Education Section.
Trade Smarter - Sign up for the DailyFX Newsletter
Receive timely and compelling market commentary from the DailyFX team
USD/CAD FUNDAMENTAL OUTLOOK
The Canadian Dollar rallied yesterday breaking below the stubborn 1.35 level and gaining 200 odd pips against the greenback. The pair had shown signs of a potential breakout after last week’s head and shoulders pattern formation discussed in the weekly Canadian Dollar forecast.
The move on USD/CAD yesterday was largely facilitated by the fall in US CPI numbers which printed well below the forecasted figure. The weakening inflation numbers saw the dollar take a beating across the board as the dollar index recorded its worst day of losses in 2022. The CPI print also had a notable effect on the Fed rate hike odds for its December meeting with markets now pricing the probability of a 50bp hike at 85%. This serves as a perfect opportunity for the Fed to slow the pace of rate hikes in December which should be a welcome reprieve for US consumers heading toward the holiday season.
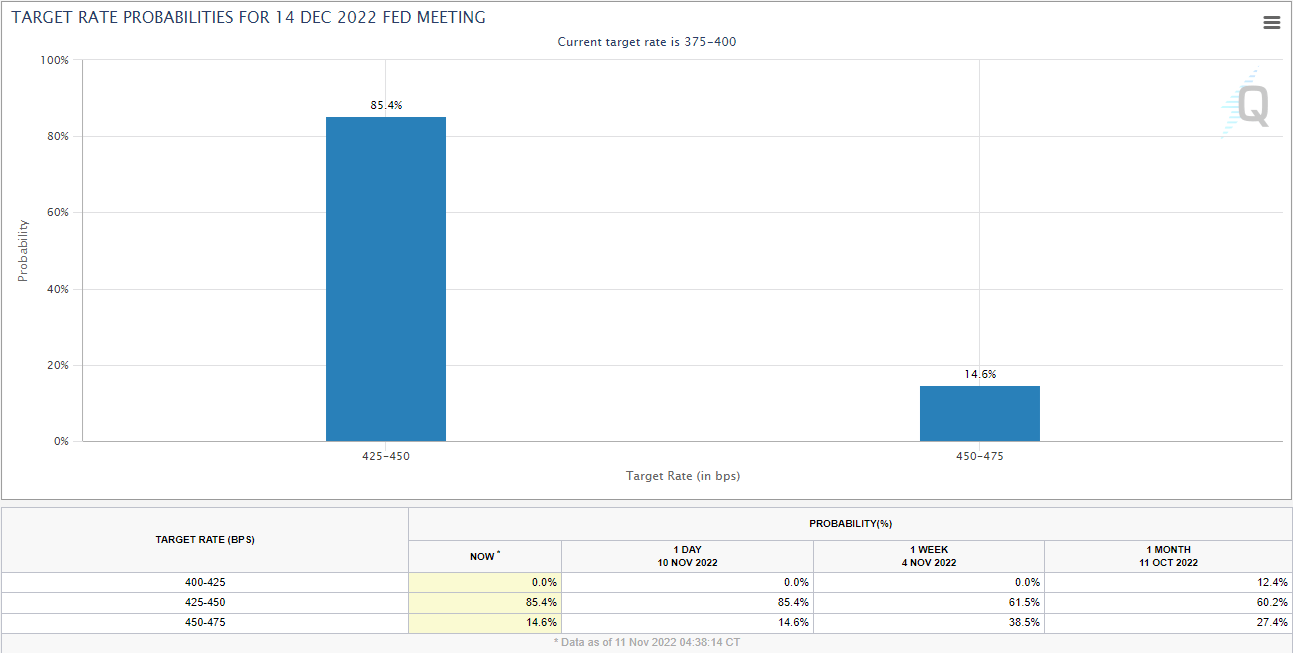
Source: CME FedWatch Tool
Fed policymaker Patrick Harker spoke yesterday following the CPI release and took a noticeably dovish tone which weighed further on the greenback. Harker stated that he expects a slowdown in the pace of rate hikes with a 50bp hike still seen as significant action. Perhaps the most telling comment from policymaker Harker was that he would be okay taking a brief pause when rates are around 4.5% and “see how things are moving”. A 50bp hike in December will bring the Fed funds rate to 4.5% and given Harker’s comments could we realistically see a pause from the Fed heading into 2023?

Economic data was sparse from Canada this week with a speech from Bank of Canada Governor Tiff Macklem the only highlight. Governor Macklem left the door open for a further outsized rate hike while stating that policymakers have noted ‘some tiny little green shoots’ in recent data releases. Markets took the Governors comments as slightly dovish evidenced by the peak interest rate expectation declining from 4.5% toward 4.25% mark. Next week will be key as Inflation numbers are released in Canada which should provide markets with a clearer indication of what to expect moving forward.
For all market-moving economic releases and events, see the DailyFX Calendar
USD/CAD D Chart, November 11, 2022
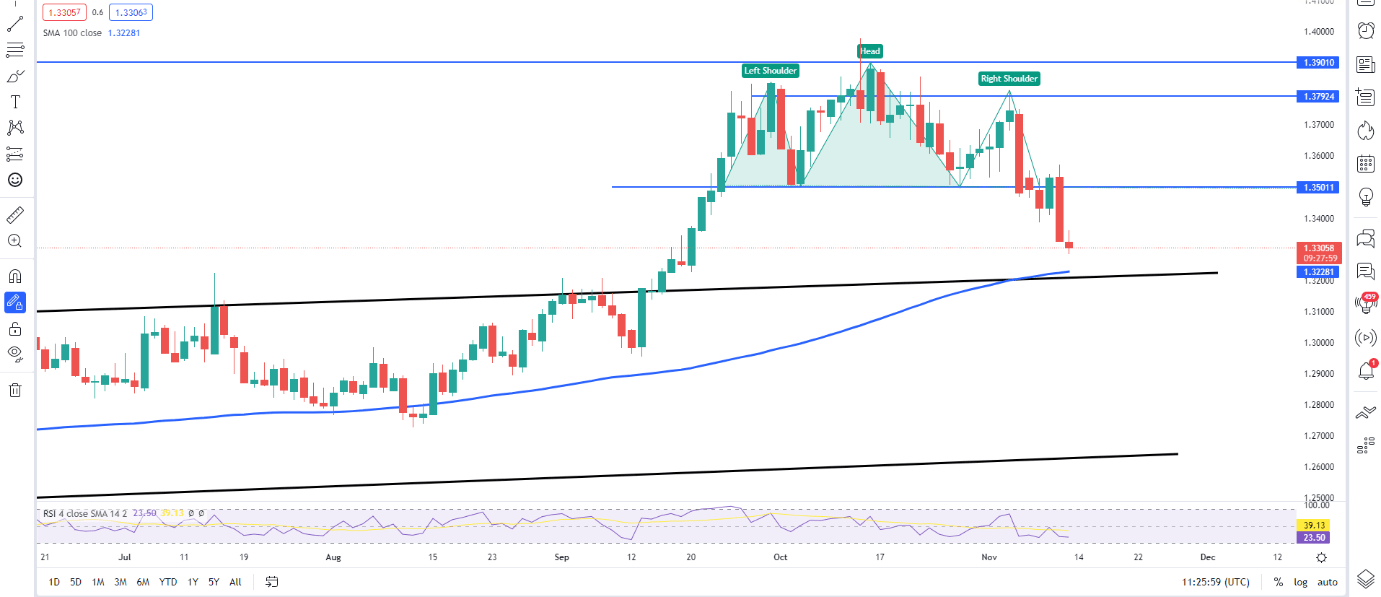
Source: TradingView, Prepared by Zain Vawda
Outlook and Final Thoughts
CAD posted significant gains against the greenback breaking below the 1.35 level and declining a further 200 odd pips. The head and shoulders pattern printed last week provided a hint of a potential move, yet the pair remained stubborn in the early part of the week.
The daily candle closed as a marubozu candlestick highlighting the selling pressure on the pair as it trickled further down in European trade. There remains a significant support area just below current price with the 100-SMA and the level associated with the previous channel breakout standing in the way of further declines. Should the pair find support here there could be room for retracement on the pair as the RSI approaches oversold territory.
| Change in | Longs | Shorts | OI |
| Daily | -2% | 7% | 5% |
| Weekly | -30% | 38% | 13% |
Resources For Traders
Whether you are a new or experienced trader, we have several resources available to help you; indicators for tracking trader sentiment, quarterly trading forecasts, analytical and educational webinars held daily, trading guides to help you improve trading performance, and one specifically for those who are new to forex.
--- Written by Zain Vawda for DailyFX.com
Contact and follow Zain on Twitter: @zvawda


