


US Equities (S&P500, Nasdaq 100 and Dow Jones) Analysis
- Equities get the ‘green light’ from Powell as global sentiment improves
- Tech heavy Nasdaq outshines S&P and Dow – rising from a lower level
- S&P 500 bounces higher off zone of support with the longer-term trendline in reach
- Dow Jones has been the most resilient of the indices, already entering a bull market
- The analysis in this article makes use of chart patterns and key support and resistance levels. For more information visit our comprehensive education library

Equities Get the ‘Green Light’ from Powell as Global Sentiment Improves
Fed Chair Jerome Powell’s comments yesterday evening were about as dovish as he could muster, as the growing number of dovish voices within the Fed increases. If you throw your mind back to the minutes of the November Fed meeting, which confirmed that “a substantial majority of participants judged that a slowing in the pace of increase would likely soon be appropriate”. This laid the foundation for Powell’s address last night in which he warned against the risk of overtightening and hinted at a slower 50 bps hike in December.
US equity markets remain extremely receptive to even the smallest sliver of good news and thus advanced on the back of the statement. The tech heavy Nasdaq, which lagged the S&P 500 and Dow Jones recently, rose the most, just under 4.5% with the S&P 500 up 3% and the Dow up 2.18%.
A further supportive influence for higher equity valuations centers around the relaxation of lockdown measures in China after mass protests ensued. Asian equities remain downbeat given the instability and record new Covid cases which have gripped the nation this winter. April’s prior high of 29,520 new covid cases has been eclipsed by the recent numbers which sit around 71,310.
Nasdaq 100
The Nasdaq 100 was the star performer yesterday despite it having lagged the other two US indices below. Higher interest rates naturally pose a challenge to tech growth stocks which tend to have difficulty turning consistent profits. Challenges to further upside appear at the 12,250 level which holds significance from 2020, 2021 and 2022. Thereafter, 12,950 is the next level of resistance.
A possible pullback after the recent advance could rest at 11.540 – the level where price action had congregated in the lead up to the move higher. The Nasdaq is perhaps placed in a prime position as it has hardly moved off its low and therefore, if bullish momentum continues, could have some room to run yet.
Nasdaq 100 E-Mini Futures Daily Chart
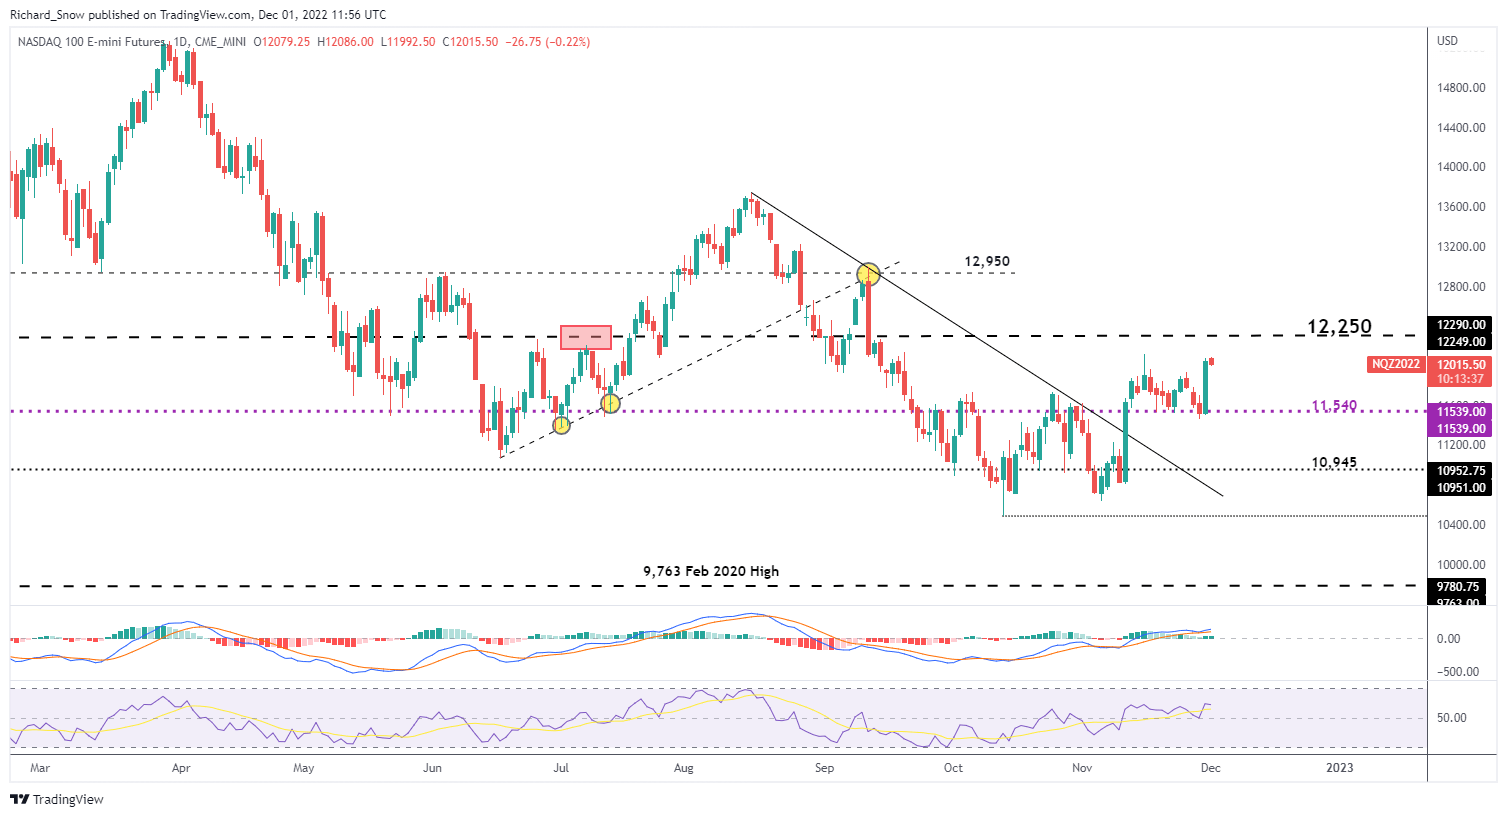
Source: TradingView, prepared by Richard Snow
S&P 500
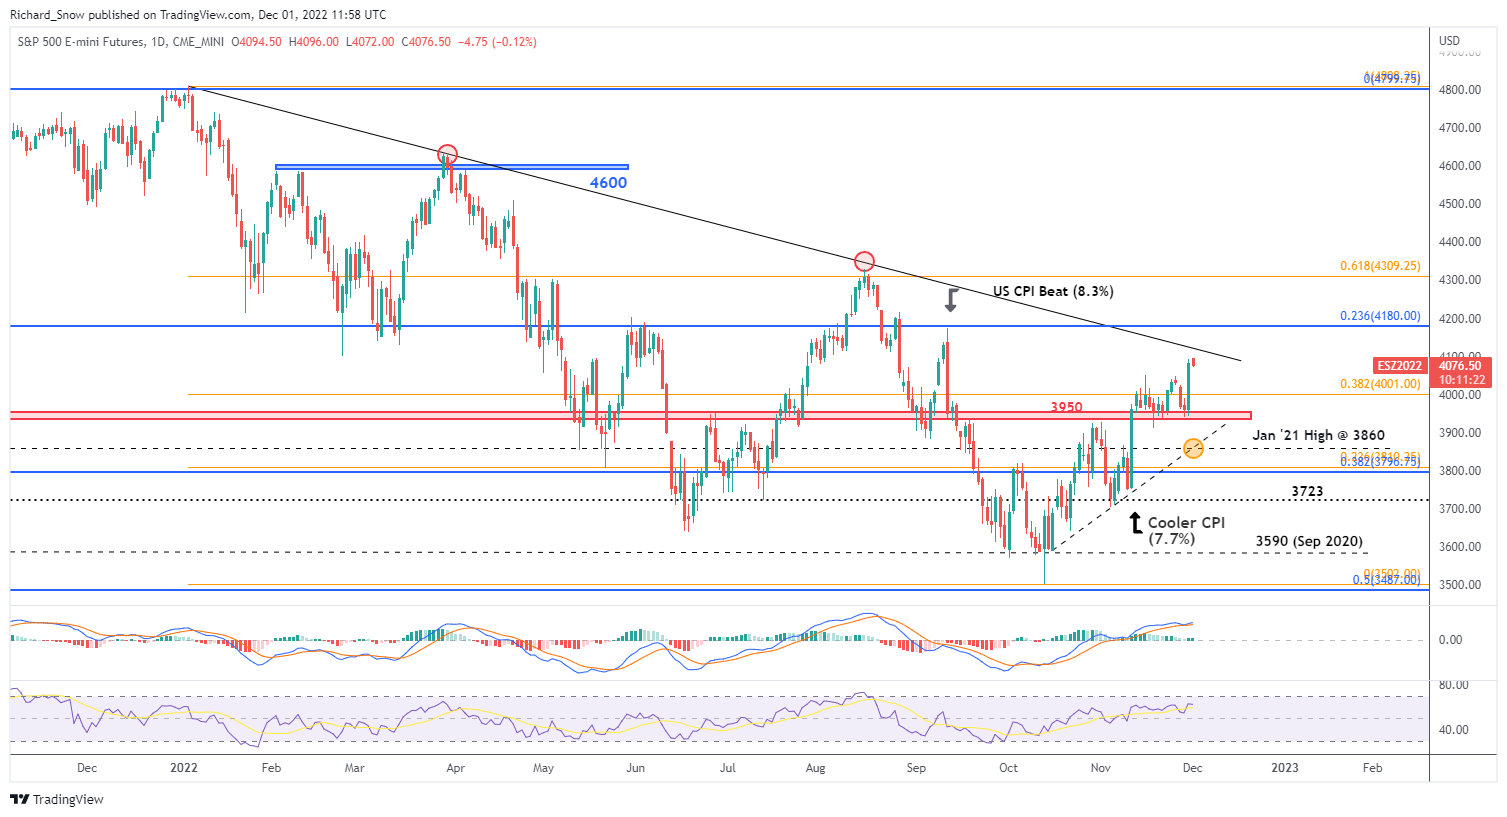
The S&P 500 has fared relatively better than the Nasdaq and exhibited a clean bounce higher off the 3050 zone of support. The rise now bring the long-term descending trendline of support into play and appears as the nearest area of resistance. The trendline has been extremely robust in the past, meaning a break above, with sufficient momentum, adds weight to a bullish reversal although, it is still too early to come to this conclusion. The next level of resistance appears via the 23.6% Fib retracement of the 2020 – 2021 move (4180).
Support resides at the 3950 zone, followed by the rising (dotted) trendline support, 3860 and then the coinciding Fib levels around 3800.
S&P 500 E-Mini Futures Daily Chart
Source: TradingView, prepared by Richard Snow
Dow Jones
The Dow Jones, as mentioned earlier, has been the pick of the three US indices as it has technically left the bear market after rising more than 20% from the October low. A hold above the prior high at 34,280 keeps the bullish momentum alive.
Dow Jones Industrial Average Daily Chart
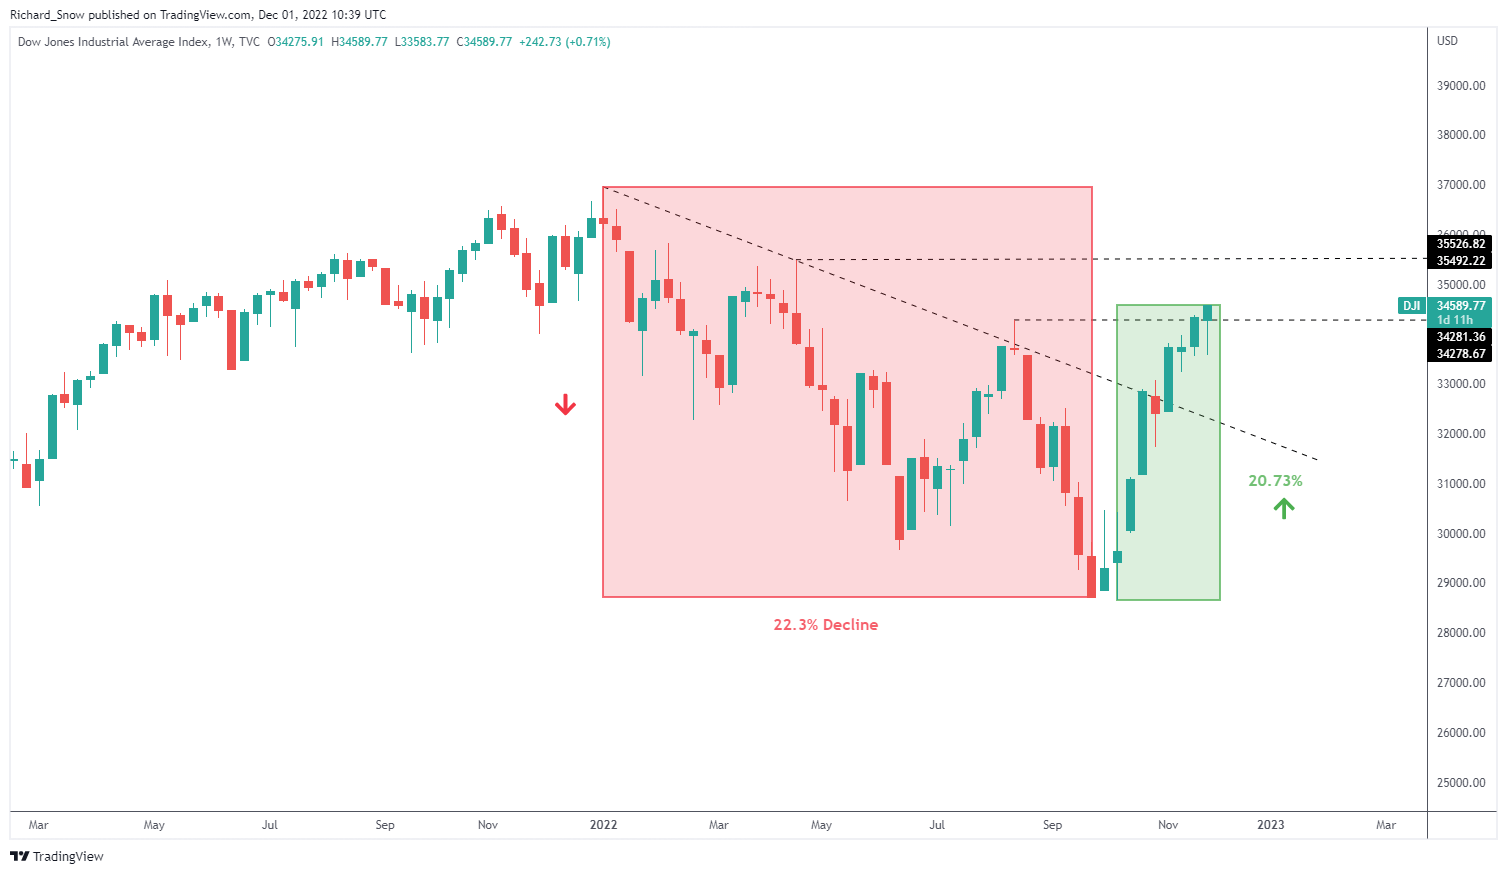
Source: TradingView, prepared by Richard Snow
The daily chart reveals what appears as a morning star candlestick pattern – although it appears within an uptrend instead of the usual downtrend. Nevertheless, it suggests a bullish impetus at the higher low, propelling price action higher. Something to note on the Down is the hint of a change in momentum via the MACD which reversed strongly in August and the near ‘overbought’ conditions on the RSI, hinting that a pullback may soon be appropriate under current market conditions.
Dow Jones Daily Chart
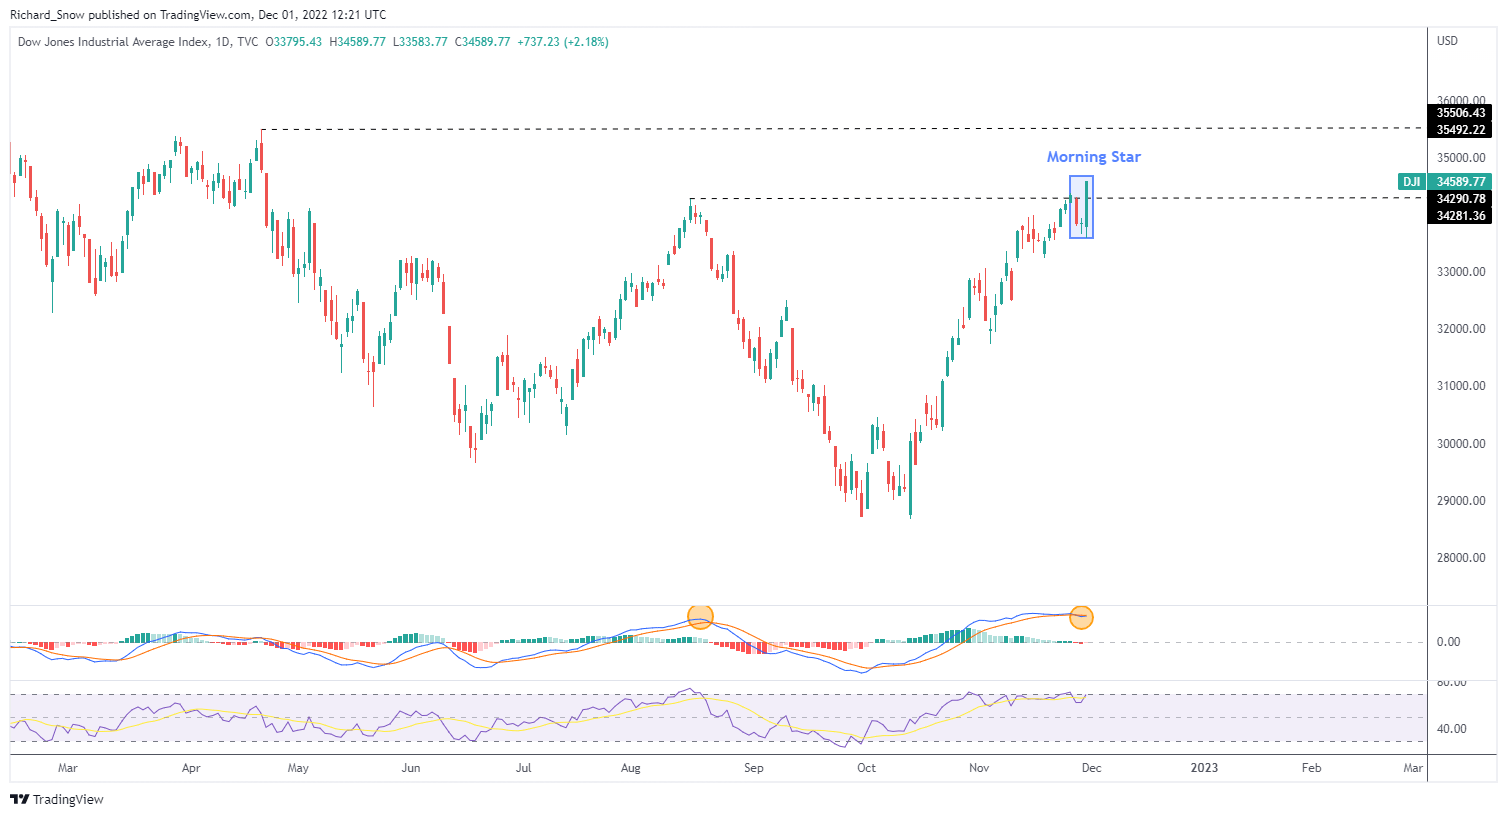
Source: TradingView, prepared by Richard Snow
--- Written by Richard Snow for DailyFX.com
Contact and follow Richard on Twitter: @RichardSnowFX


