


US Crude Oil Analysis and Charts
• Crude prices remain above recent lows
• Demand forecasts have been tweaked higher
• Strong downtrend still dominates the daily chart
Download our Free Guide to Help You When Trading Oil

Crude oil prices gained a little in Europe on Tuesday following the rare recent sight of two straight daily sessions of strong gains. The market managed to get back into the green after United States inflation data came in a little weaker than expected, raising hopes alive that interest rates may not rise again anytime soon.
The International Energy Agency raised its own oil demand growth forecasts during the session. The agency’s forecast for this year was upped to 2.4 million bpd, from 2.3, with 2024’s expectation despite tipping slower growth across almost all major economies.This didn’t have a lasting effect on prices, suggesting that the market remains extremely wary after rises already seen. Those were largely inspired by November’s monthly report from The Organization of the Petroleum Exporting Countries which did a little to counter the market’s prevailing gloom. OPEC laid the blame for the heavy falls seen since September squarely at the doors of speculators and ‘overblown’ negative sentiment in a fundamentally strong market. It also increased its forecast for overall oil demand this year by 20,000 barrels per day and stuck to its relatively bullish call for 2024 (2.25 million bpd).
Still, oil prices have been under severe pressure for the past two months with investors worried about the likely extent of demand. Those worries focus primarily on both the US and China but also take in other major economies still contending with interest rates higher than have been seen for a generation. OPEC is clearly doing what it can to push back against this thesis, pointing out that overall oil market supply remains pretty tight, but it’s probably too early to call an end to the bearish rethink that’s taken place since September.
Prices have also reportedly been boosted by signs that the United States is cracking down on sanctions-busting by Russia. Reuters reported that the US Treasury has asked ship-management companies for details of a hundred vessels it suspects of violating Western measures against the movement of Russian oil. However, the market could shortly see increased supply from major producer Iraq. Its oil minister has reportedly said that talks to restart supply pipelines through Turkey from its Kurdish regions could soon reach an agreement. This could see an additional half million barrels per day on stream.
The next major oil-specific economic data release will come on Wednesday. That day will bring the US Energy Information Administration’s look at inventory levels for crude oil and other petroleum products.
US Cude Oil Technical Analysis
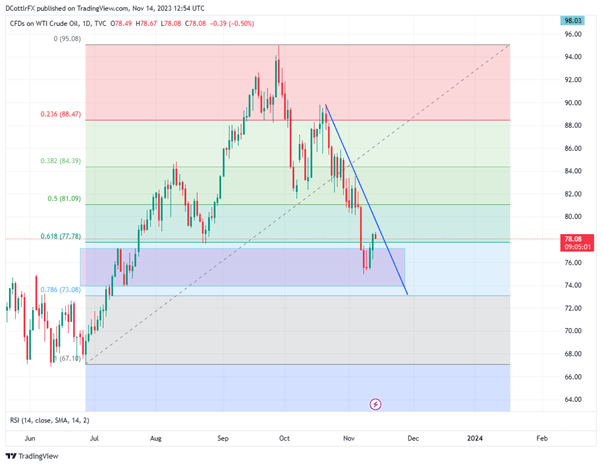
US West Texas Intermediate Daily Chart Compiled Using TradingView

Prices have bounced quite strongly, having retreated late last week into a trading band not seen in mid-July It’s bounded by July 13’s top of $77.34, which now acts as near-term support and July 17’s low of $74.03 which guards the path lower to the next significant Fibonacci retracement level at $73.08.
Recent gains have pushed prices back above the previous retracement of $77.78 but the market remains very close to that level and it’s probably too soon to say that it can comfortably remain above that point.
A very steep downtrend line from October 19 still dominated this market, itself an acceleration of the slide seen since the peaks of September 28 above $95. That downtrend line offers bulls a tempting near-at-hand target of $79.31 with an inability to crack that level into this week’s close likely to prove quite bearish. It’s notable that Monday’s gains came despite sliding overall market volume and open interest which may cast doubts on their durability.
IG’s own sentiment data finds the market overwhelmingly net long at current prices, to an extent that may argue for a contrarian call now.
| Change in | Longs | Shorts | OI |
| Daily | -9% | 13% | -5% |
| Weekly | 6% | -1% | 4% |
--By David Cottle for DailyFX


