


FTSE 100 Talking Points:
- FTSE 100 breaks technical barrier of resistance turned support at 7000.
- UK equities drive FTSE higher ahead of US CPI.
- Price action returns to 2018 levels with the all-time high looming at 7903.

FTSE 100 Rises to 2018 Levels Despite Rising Risks of a Global Recession
FTSE 100 prices continue to track higher, defying the risks of a global recession. With the major UK equity index conquering prior technical hurdles that have remained in place since 2019, the fundamental outlook has done little to deter FTSE bulls.
With price action currently holding above the key psychological level of 7700, a move above the January 2020 pre-pandemic high of 7689 has supported the recent move.
FTSE 100 Weekly Chart
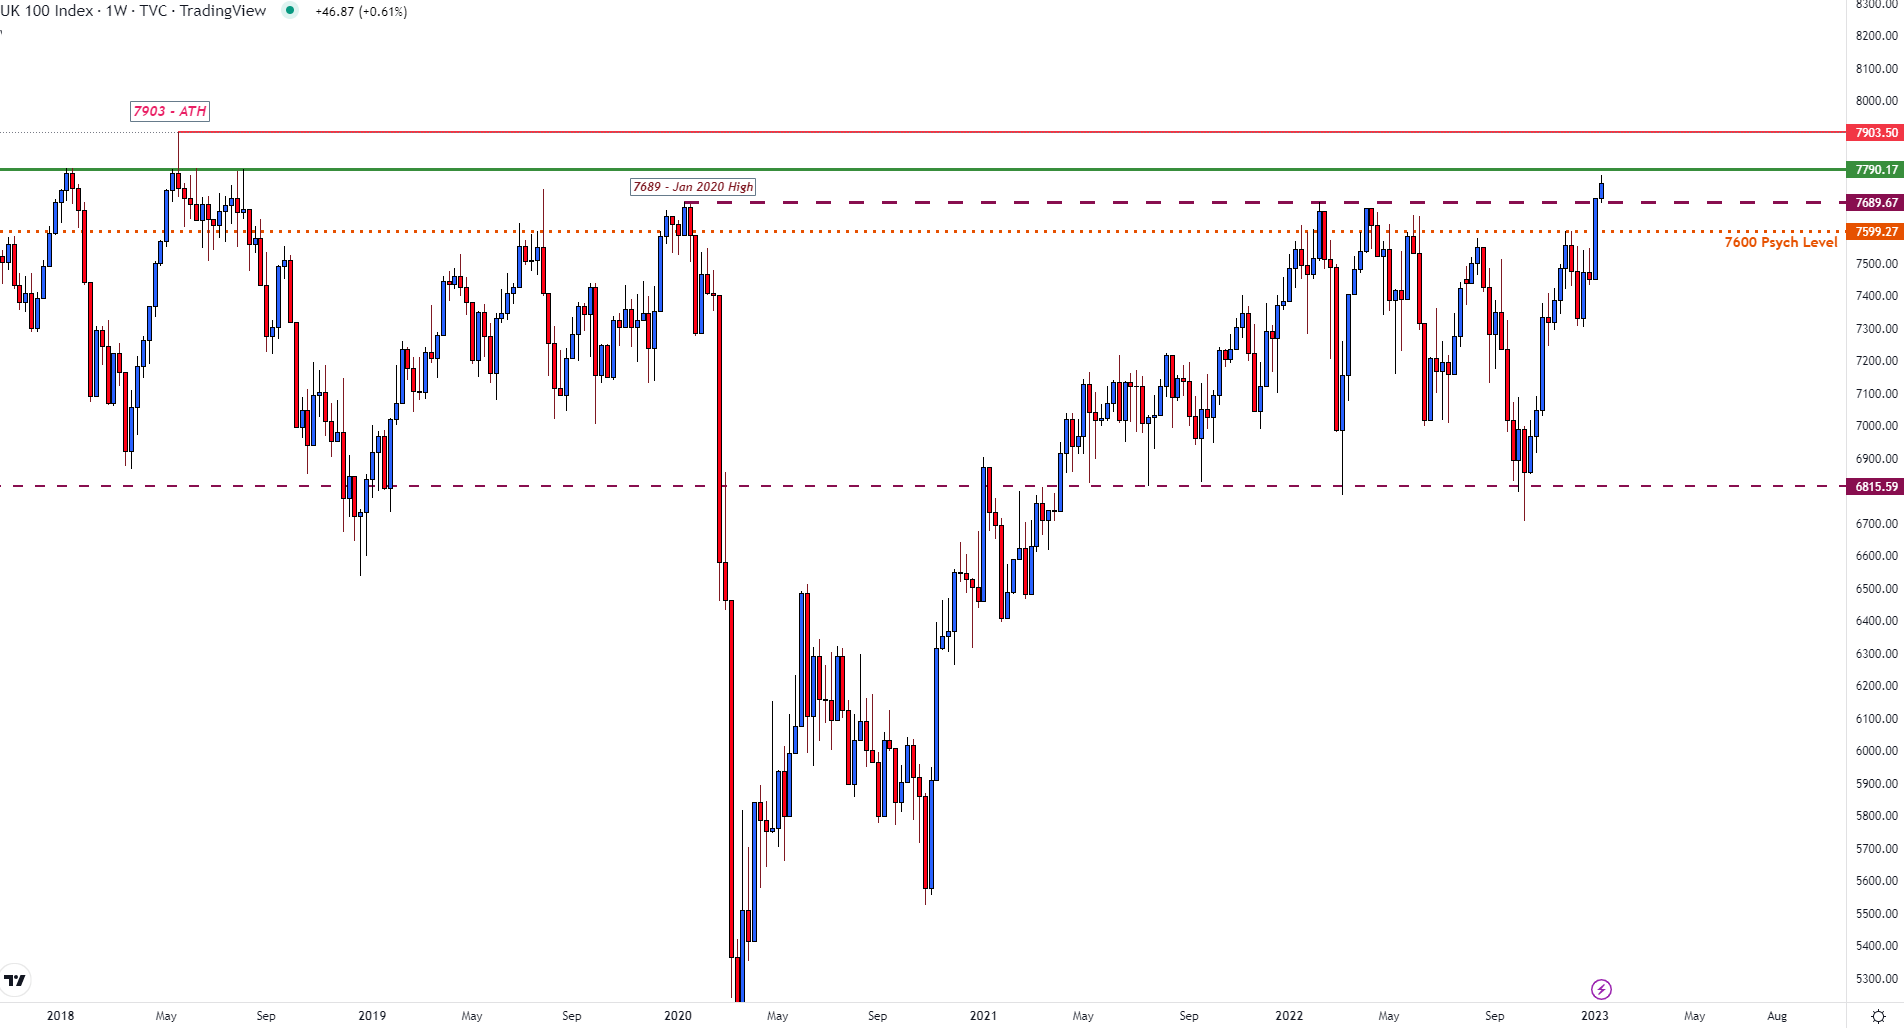
Chart prepared by Tammy Da Costa using TradingView
Much like its global stock counterparts, the UK equity index that represents the largest 100 companies in the United Kingdom struggled to hold gains throughout last year. With the onset of the Coronavirus pandemic driving prices to a low of 4898.79 in March 2020, a combination of technical and fundamental factors have contributed to the FTSE recovery since.

To combat the effects of the global lockdowns initially implemented to prevent the virus from spreading, low interest rates and quantitative easing measures assisted in driving a rebound in equities.
As the recovery gained traction, an approximate 56% rally allowed the FTSE 100 to rise back above 7000 before reaching a high of 7687 in February last year.
However, with the war in Ukraine exacerbating price pressures, elevated inflation and diminishing growth forecasts dampened sentiment, driving prices lower. Although rising volatility and uncertainty resulted in large price swings occurring throughout 2022, failure to gain traction above 7600 helped ease the upside move.
After a strong start to 2023, a strong bullish move has allowed FTSE to push higher, driving prices above prior resistance turned support at 7689.
FTSE 100 Daily Chart
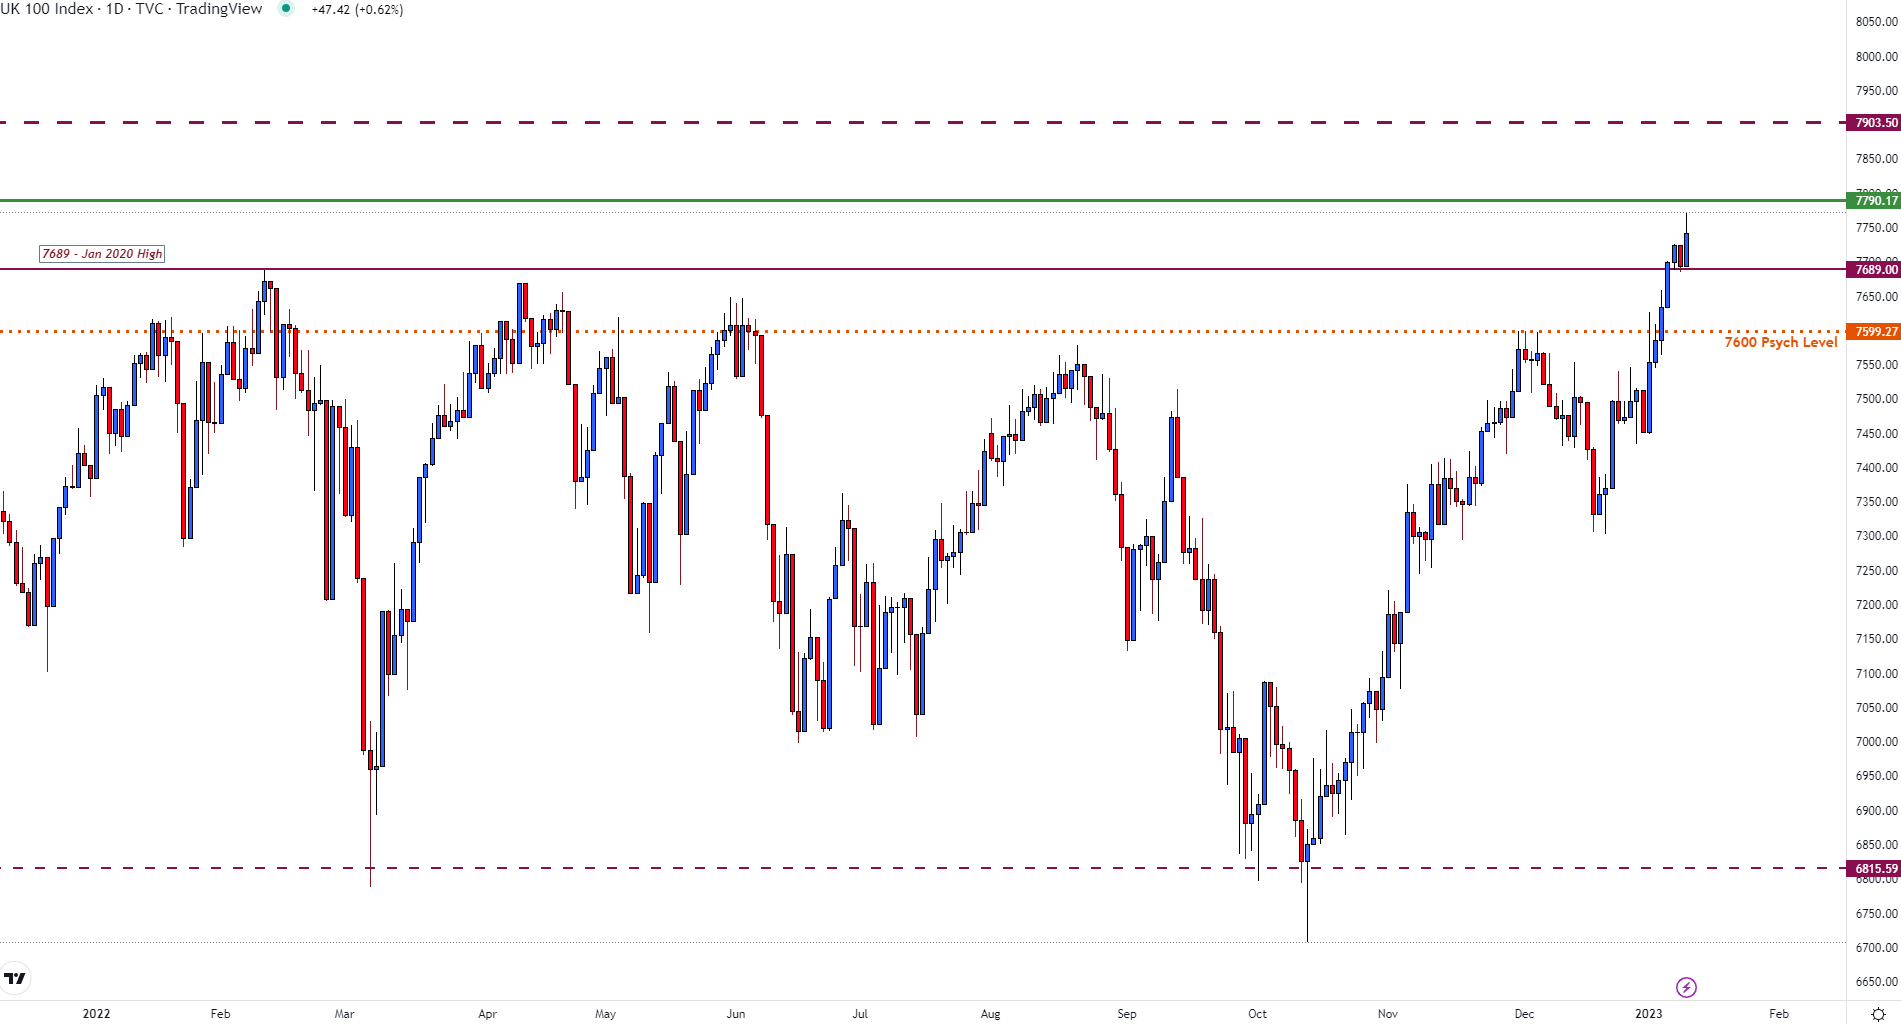
Chart prepared by Tammy Da Costa using TradingView
FTSE 100 Technical Levels
With the current monthly high holding around 7724, the 7790 – 7793 zone providing resistance throughout 2018, a move higher could drive prices higher.
While the all-time high remains in sight at 7903, the 7800 psychological level could provide another hurdle for the short-term move.
However, with rate expectations and the inflation narrative still dominating sentiment, tomorrow’s US CPI print could provide an additional catalyst for price action.
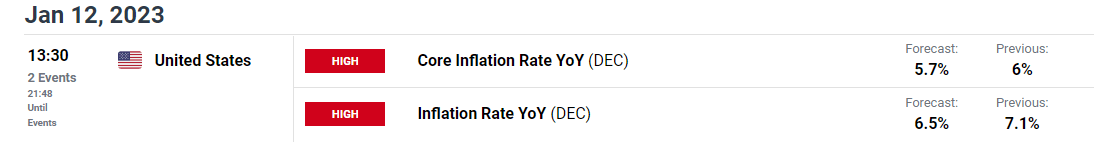
DailyFX Economic Calendar
If inflation remains elevated, the probability of another aggressive rate hike at the upcoming FOMC could place additional pressure on stock indices.
Trade Smarter - Sign up for the DailyFX Newsletter
Receive timely and compelling market commentary from the DailyFX team
--- Written by Tammy Da Costa, Analyst for DailyFX.com
Contact and follow Tammy on Twitter: @Tams707


