


S&P 500, Dollar, Monetary Policy, Recession, EURUSD and USDJPY Talking Points:
- The Market Perspective: S&P 500 Eminis Bearish Below 3,900; USDCNH Bearish Below 7.0000; USDJPY Bullish Above 127.00
- The S&P 500 posted its biggest weekly advance in 2 months to the threshold of breaking its bear trend while the Dollar posted an equivalent historical loss to land at its 2021-2022 midpoint
- There is real technical pressure behind the markets, but do we have the fundamental backdrop necessary to forge the conviction necessary to turn trends?

We are forming a nasty 2023 habit of closing out trading weeks on cliffhangers with tentative technical moves that fall critically short of fostering a genuine sense of conviction for directional traders. Given that we are coming out of the year-end holiday trading period, there is an abundance of technical levels carrying over from the last quarter and the systemic fundamental themes remain unresolved; this lack of clarity is fitting. That said, we don’t have to like it and traders should continue to evaluate the scenarios and catalysts that will eventually bring this uneasy situation to an end. Will we find conviction in the week ahead? Looking to the economic docket, it doesn’t look like we are planning to absorb the fundamental updates that would give us a definitive bearing on top themes.
On the other hand, the charts are provocative and are likely to generate considerable volatility even in the absence of a true trend. For illustration of this situation, there is no better representative than the S&P 500. The most representative US index across the financial spectrum advanced 2.7 percent this past week to close just above the 200-day moving average. Was that the definitive break? Shouldn’t breaks come when there is fuel (liquidity) to heap onto the fire? There is a lot of speculative ambiguity to this situation; and I will be waiting until next week – after the US exchanges are back online after the extended holiday weekend – to make that call for myself.
| Change in | Longs | Shorts | OI |
| Daily | 1% | -1% | 0% |
| Weekly | 15% | -13% | -1% |
Chart of the S&P 500 with Volume, 50 and 200-Day SMAs and ‘Wicks’ (Daily)
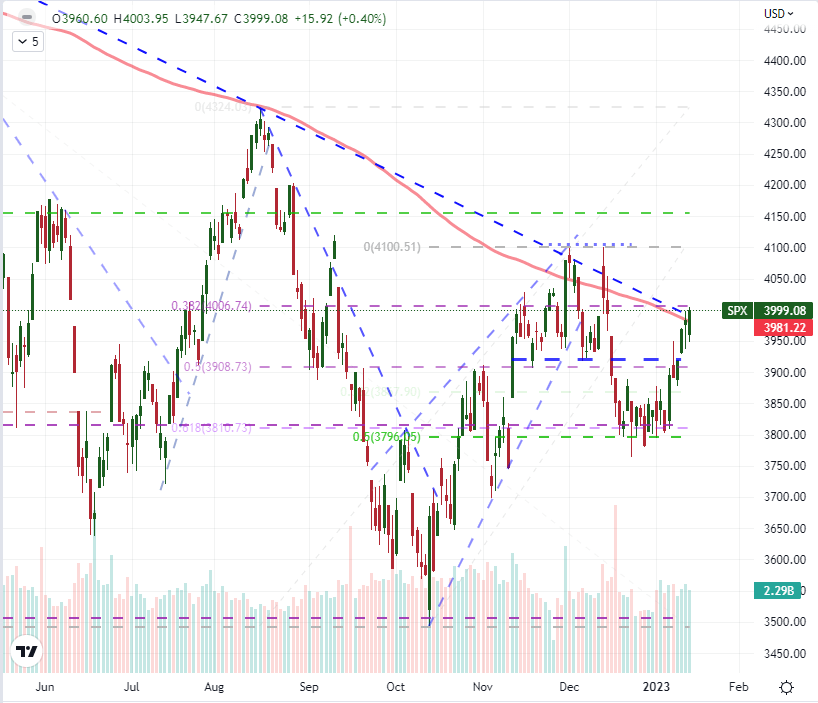
Chart Created on Tradingview Platform
One of the principal headwinds for me in projecting the S&P 500’s bullish ambitions is the lack of a strong fundamental backdrop for the transition from 2022’s general bear trend into a more productive recovery. We have seen little to improve the outlook for economic activity in the world’s largest economy. Beyond the IMF’s warnings over the global outlook to start the year, we heard forecasts for a ‘mild recession’ form the JPMorgan and Bank of America earnings events. So where is the lift coming from? It seems that ‘plateauing’ of the Federal Reserve’s most aggressive tightening regime in decades is a source of enthusiasm. If the markets had overshot the forecast significantly and had to retrace or the peak was at a historically deflated level, that could be the genesis of some genuine buoyancy.
That said, the actual outlook for rates is leveling out not far from where the Fed said it would at a notably restrictive level. Following the extended US CPI deceleration this past week, the market’s own rate forecast for the Fed hasn’t dropped materially. Nevertheless, the DXY Dollar index dropped another -1.7 percent – closing in on the midpoint of the 2021-2022 rally. Is that enough shake out of an overextended premium? If so, we will need to look for something more tangible to keep the bearish trend rolling.
Chart of DXY Dollar Index with 50 and 100-Day SMAs and US 2-Year Yield (Daily)
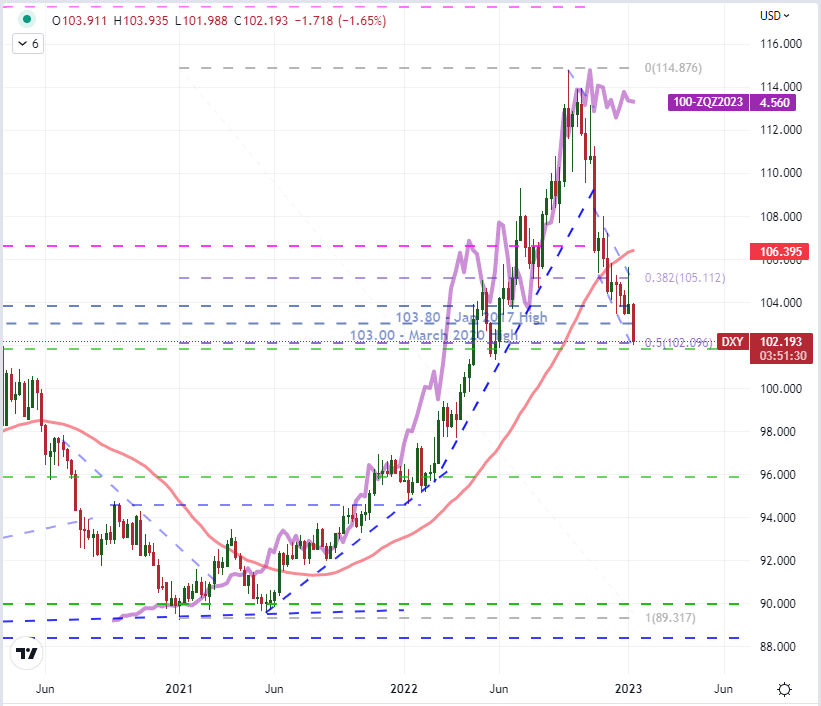
Chart Created on Tradingview Platform
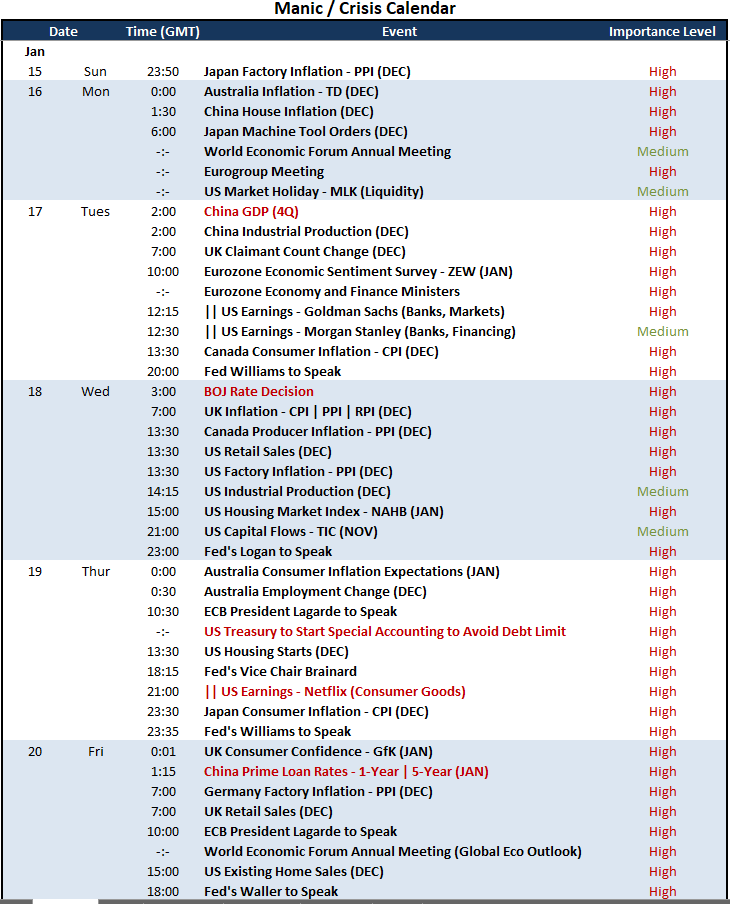
If there ever a time for a top level event to offer clarity of conviction for the broader financial system, this would be it. Unfortunately, the docket doesn’t seem in a position to provide that definitive view. From the US calendar, we lack an event with the gravitas to reach globally and deep into speculative assumption (like a FOMC rate decision). Retail sales, the NAHB housing market index and similar reports are noteworthy, but not overriding. Nor will earnings updates like Netflix, Goldman and Alcoa redefine the bigger picture. That is not to say that these are events capable of generating volatility. They certainly are. Further, there is notable event risk from other regions. However, there are significant hurdles to these listings escalating to global juggernaut. The Chinese 4Q GDP reading is such an important listing, but the markets don’t take Chinese data at face value. The Bank of Japan rate decision could redefine the lower bounds of global monetary policy, but the focus seems to be more on the upper threshold. It’s all worthy of monitoring, but not to fully adapt our plans.
Top Global Macro Economic Event Risk for Next Week
Calendar Created by John Kicklighter
While I will be watching the systemically important fundamental themes and assets moving forward, I also like to take a global macro pragmatic approach – meaning, I will focus on where the volatility is likely to show up. An overlooked Dollar-based cross, USDCNH (Dollar-Chinese Yuan) is a globally important exchange rate. While there may still be some external influence on this pair, it has been registered its biggest three-week slide on record after completing a large head-and-shoulders pattern, abiding the historical importance of the 7.0000 intervention mark and against the backdrop of the Chinese economy’s reopening from aggressive Covid quarantine requirements. How far will the currency of the world’s second largest economy run – and how far will the government of a principally export-driven economy let it run? With the Chinese GDP reading near the beginning of the week and the PBOC equivalent of a rate decision at the end of it, this is a pair to watch.
Chart of USDCNH with 200-Day SMA (Daily)
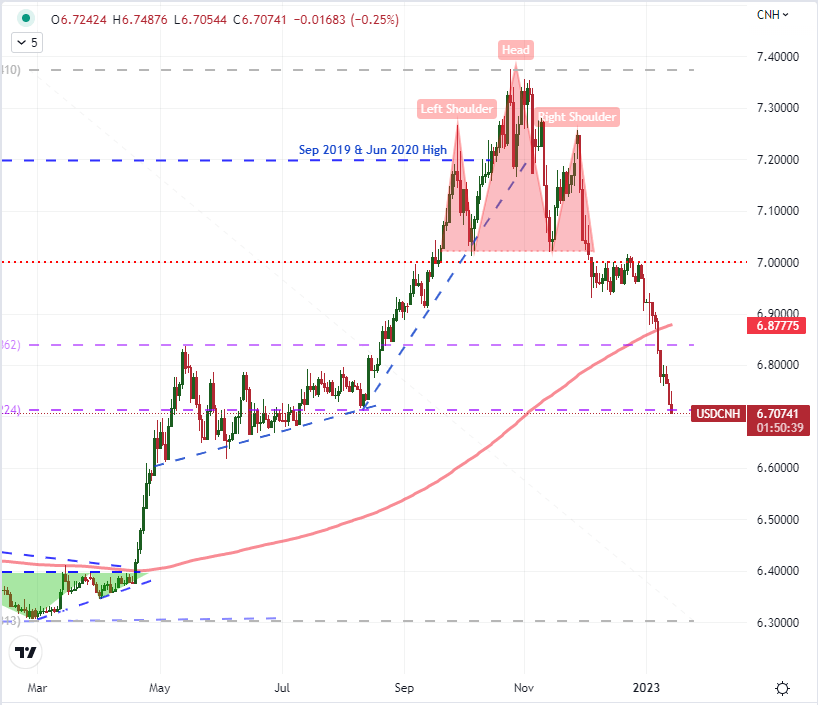
Chart Created on Tradingview Platform
The other particular technical and fundamental highlight on the global macro side for me is USDJPY. The Dollar’s tumble in general has done a lot to push this second most liquid cross into a serious tumble. From a multi-decade high, this pair has dropped nearly 16 percent in just a few months. That is extraordinary for one of the most liquid currency pairs in the world. I chalk up much of this progress to the market’s response to the leveling out of the Fed forecasted rate, but that view can only go so far before market’s start to realize it is a plateau at a higher rate, as the group indicated. To keep this slide going, I would expect one of two fundamental developments to add some weight. Either risk aversion will kick in and we will continue to drain carry trade built into this exchange rate or the Bank of Japan will signal that it will start to close the policy gap with its major counterparts. To appreciate what that could do for the Japanese Yen, just look to the Euro’s rally as the ECB reversed course around the middle of last year.
| Change in | Longs | Shorts | OI |
| Daily | -2% | 2% | 0% |
| Weekly | 12% | -16% | -6% |
Chart of USDJPY with 200-Day SMA and 1-Week Rate of Change (Weekly)
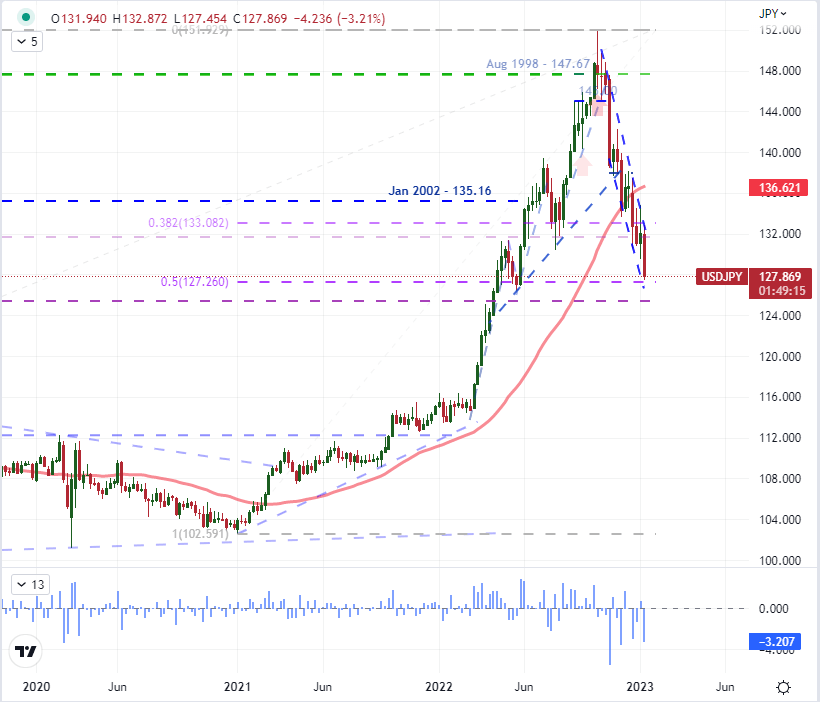
Chart Created on Tradingview Platform


