


S&P 500 Talking Points:
- The S&P 500 hit a fresh two-month-high last week, finding resistance at a familiar spot of 4100.
- The 4100 level was the swing-low in February and is now confluent with the bearish trendline taken from this year’s swing-highs. This same trendline helped to turn-around a bullish advance in August with an assist from the 200 day moving average.
- The analysis contained in article relies on price action and chart formations. To learn more about price action or chart patterns, check out our DailyFX Education section.
The S&P 500 set its current yearly low on October 13th. This was just after a CPI print was released above expectations and initially, this created a swell of weakness as the S&P 500 tipped down to the 3500 level. CPI data drops an hour before US equity markets open and on that morning, it looked like bears were going to have an open door to test that major psychological support level.
But, a bounce developed as US equities came online for the day and price hasn’t been below 3590 since. Similar to the bounce that was seen in June, intermediate-term trends have been bullish in the midst of a longer-term bearish backdrop.
Cumulatively, 2022 price action has been one big falling wedge in the S&P 500. The top was set in the first week of January and while sellers have displayed some extreme aggression at times, they’ve been stymied at lows in June and again in October, which sets up the weaker-angled trendline sitting below price.
S&P 500 Weekly Chart
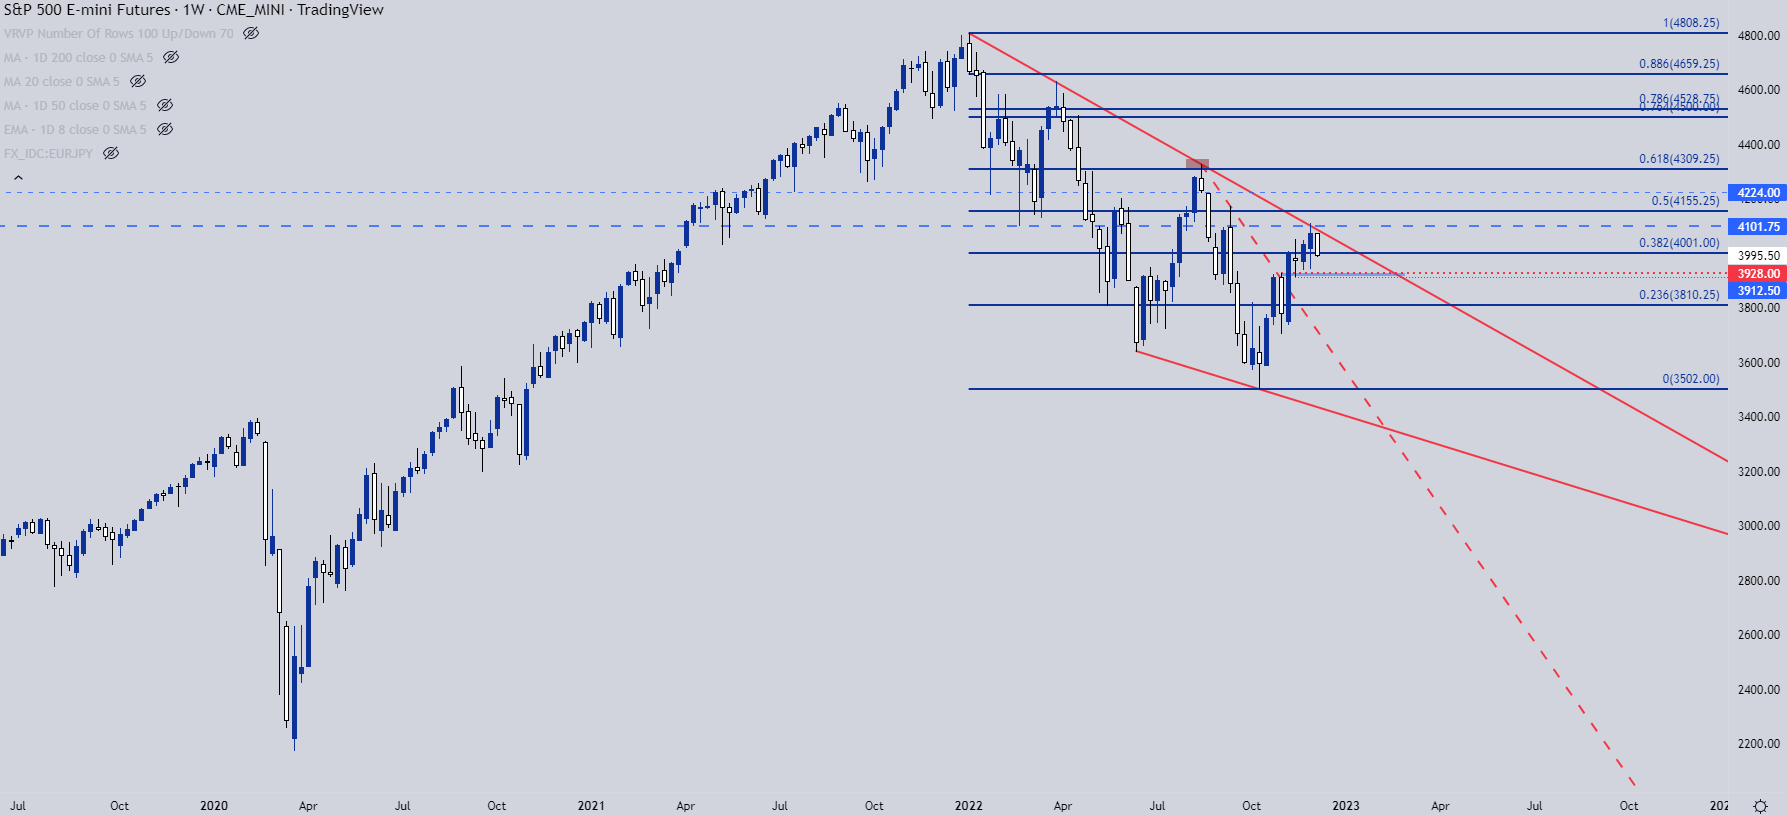
Chart prepared by James Stanley; S&P 500 on Tradingview
On the above chart, you’ll probably notice that there’s two falling wedges. The first is marked with the same support trendline but matched with a dashed resistance trendline, taken from August and September swing highs. That resistance held the highs through October and early-November, finally giving way on another CPI print that was released on November 10th. That breakout led to a higher-high which was then matched with a higher-low, and that was followed by bullish continuation into last week’s high.
The intermediate-term trend here remains bullish as we’ve had a progression of higher-highs and lows. And there’s longer-term bullish reversal potential, as illustrated by the falling wedge formation on the weekly chart above.
The big question is whether bulls can evoke a deeper reversal of the bearish move that was so prominent in the first nine months of this year.

S&P 500 Daily Chart
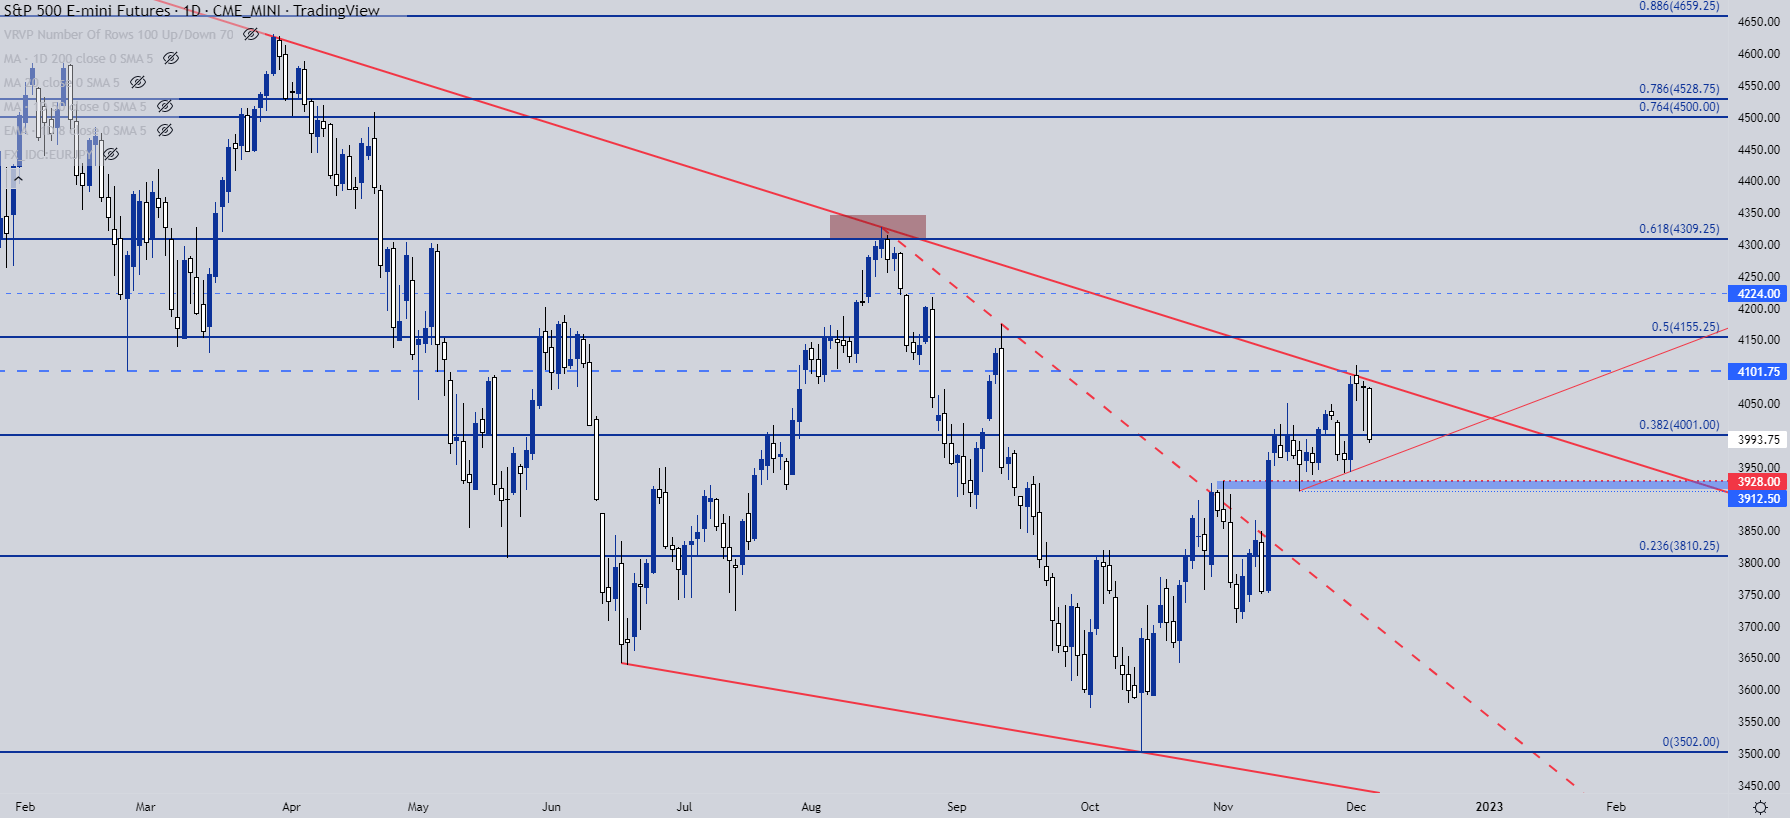
Chart prepared by James Stanley; S&P 500 on Tradingview
S&P 500 Shorter-Term
Since that trendline at 4100 came into play last Thursday, buyers haven’t been able to re-take control and short-term trends are now pointing lower as price re-tests the psychological level at 4000. The FOMC rate decision next Wednesday is likely going to be the determinant as to whether or not a ‘santa rally’ helps to push the breakout from the longer-term wedge.
For now, the focus is on near-term support to see how aggressive bears might want to be, as that can inform of bearish potential of the intermediate-term trend, as the short-term move progressively prices through prior spots of higher-low support.
Given the grind on the way up, there’s a number of possible levels to track here. The 4k level is key as this is a Fibonacci level and a psychological level. Just below that, there’s another possible support level around 3950 and below that, there’s a zone running from 3912 to around 3928 that’s a spot of resistance-turned-support. If sellers can push a break through that zone, the prospect of a deeper sell-off will begin to look more attractive.
S&P 500 Four-Hour Chart
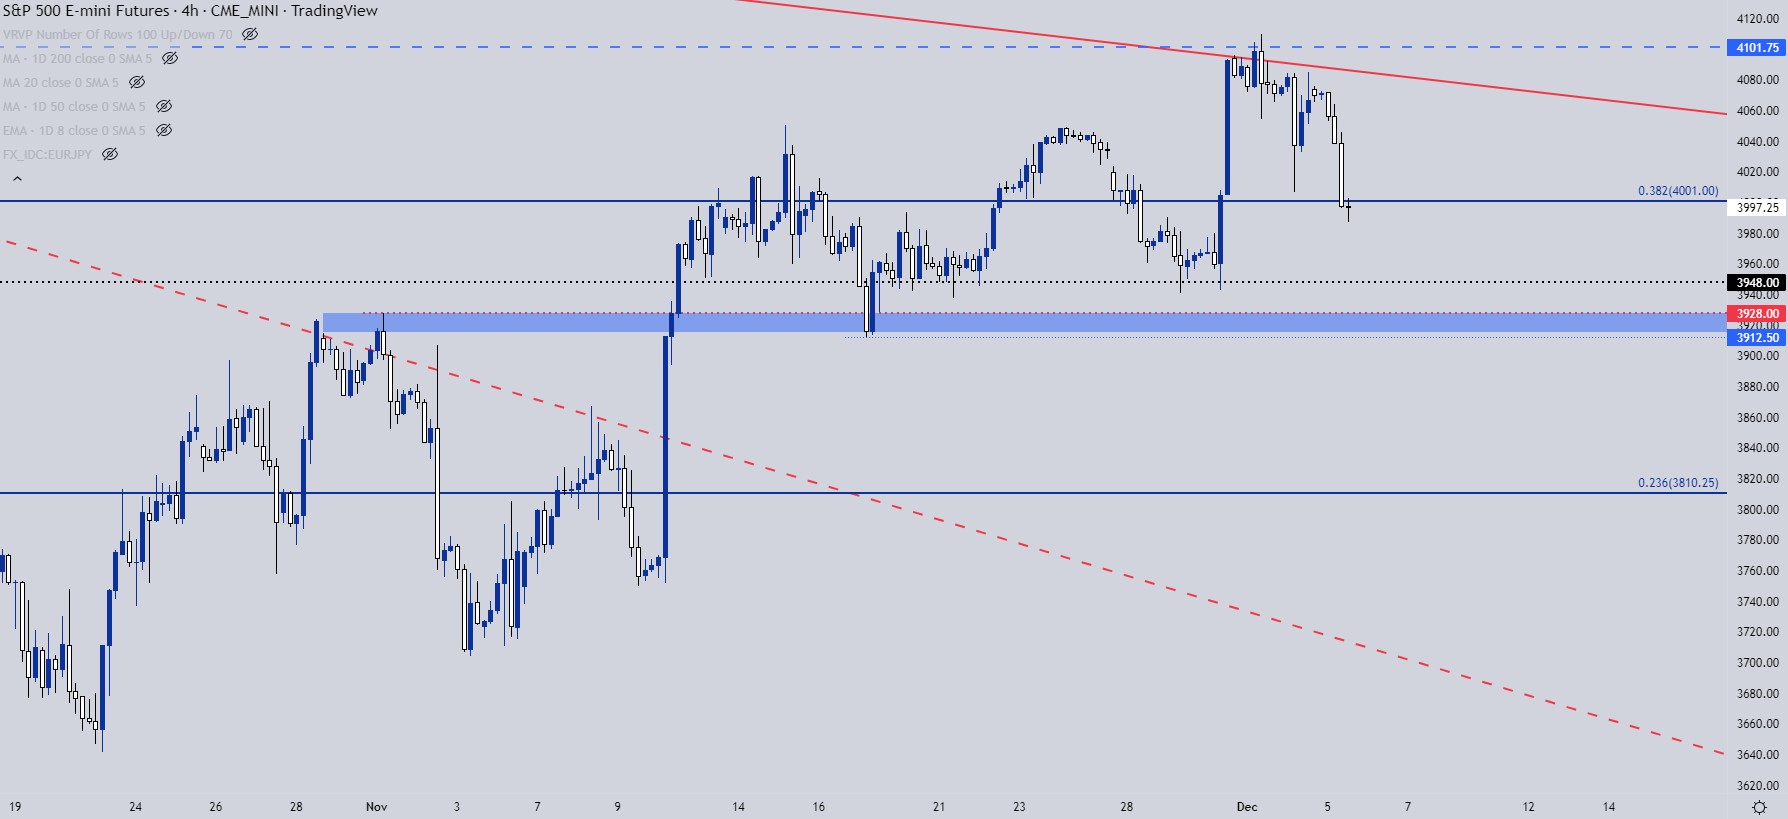
Chart prepared by James Stanley; S&P 500 on Tradingview
--- Written by James Stanley, Senior Strategist, DailyFX.com & Head of DailyFX Education
Contact and follow James on Twitter: @JStanleyFX


