


Indices Technical Forecast: Neutral
- Stocks put in a big move this week and the S&P 500 and Nasdaq both broke above falling wedge formations, often tracked for bullish reversal potential.
- The Dow has been strongest, with the S&P 500 lagging behind and the Nasdaq behind both; until the past two days when the script shifted and the Nasdaq led the way.
- The forecast for next week will be set to neutral. There’s bullish short-term potential and bearish long-term potential; but the prospect of a deeper short squeeze can keep bears at bay for the time being.
- The analysis contained in article relies on price action and chart formations. To learn more about price action or chart patterns, check out our DailyFX Education section.

We’re at a strange juncture for capital markets. It seems that the Fed still wants to see asset prices reacting to rate hikes but, similar to what happened in June and July, markets keep rising even as the Fed warns of more hikes on the way and an unfinished fight against inflation. The motto of ‘don’t fight the Fed’ has been in a particularly peculiar state of late, as Chair Powell took a rather direct tone to the matter at the rate decision earlier in November and yet, stocks found support a couple of days later and continued to rally through last week, even with another elevated inflation print that says that the Fed probably isn’t done yet.
I’m still bearish US equities on a long-term basis. The rationale being that the Fed wants to see asset prices move-lower in effort of stemming inflation, and the type of response that we saw last week suggests that there’s still considerable excess left to address. And with the Fed showing a recent tendency towards more hawkish comments after equity markets have risen, we may be in a spot where Fed-speak takes on a more-hawkish tone at some point in the not-too-distant future. This would be similar to Powell’s approach at Jackson Hole, when he took a shorter and more-pointed message to markets.
But, technical analysis doesn’t care about feelings or opinions, and what charts are showing at the moment is that there may be more life to these rallies before bears are ready to take over again. How much remains the big question but with both the Fed and CPI in the rear-view, those dominant drivers are going to take a back seat and the attention will shift towards Fed-speak in the US as market participants look for hints on forward-looking Fed policy.
On a shorter-term basis, there’s scope for continuation, even after a really strong showing last week. The S&P 500 broke out of a falling wedge formation, often tracked with aim of bullish reversals and similar to what had showed back in June before the two-month-rally appeared. The Dow has led the way, although the Nasdaq outpaced in the latter portion of last week. That may suggest that the rally is preparing to hit another stage as short-covering in tech stocks brings another possible bullish catalyst to the laggard amongst US indices.
Nasdaq 100
Just a week earlier the Nasdaq was digging into a long-term support zone. That was the Friday after the FOMC rate decision and I’m tracking the zone between Fibonacci levels at 10,501 and 10,751. The former level came into play in October and currently helps to mark the yearly low. The latter level came into play in early-November and functioned as a higher-low. That’s led to a push up to a fresh higher-high, with price testing through a key spot of resistance around 11,700.
Nasdaq 100 Weekly Chart
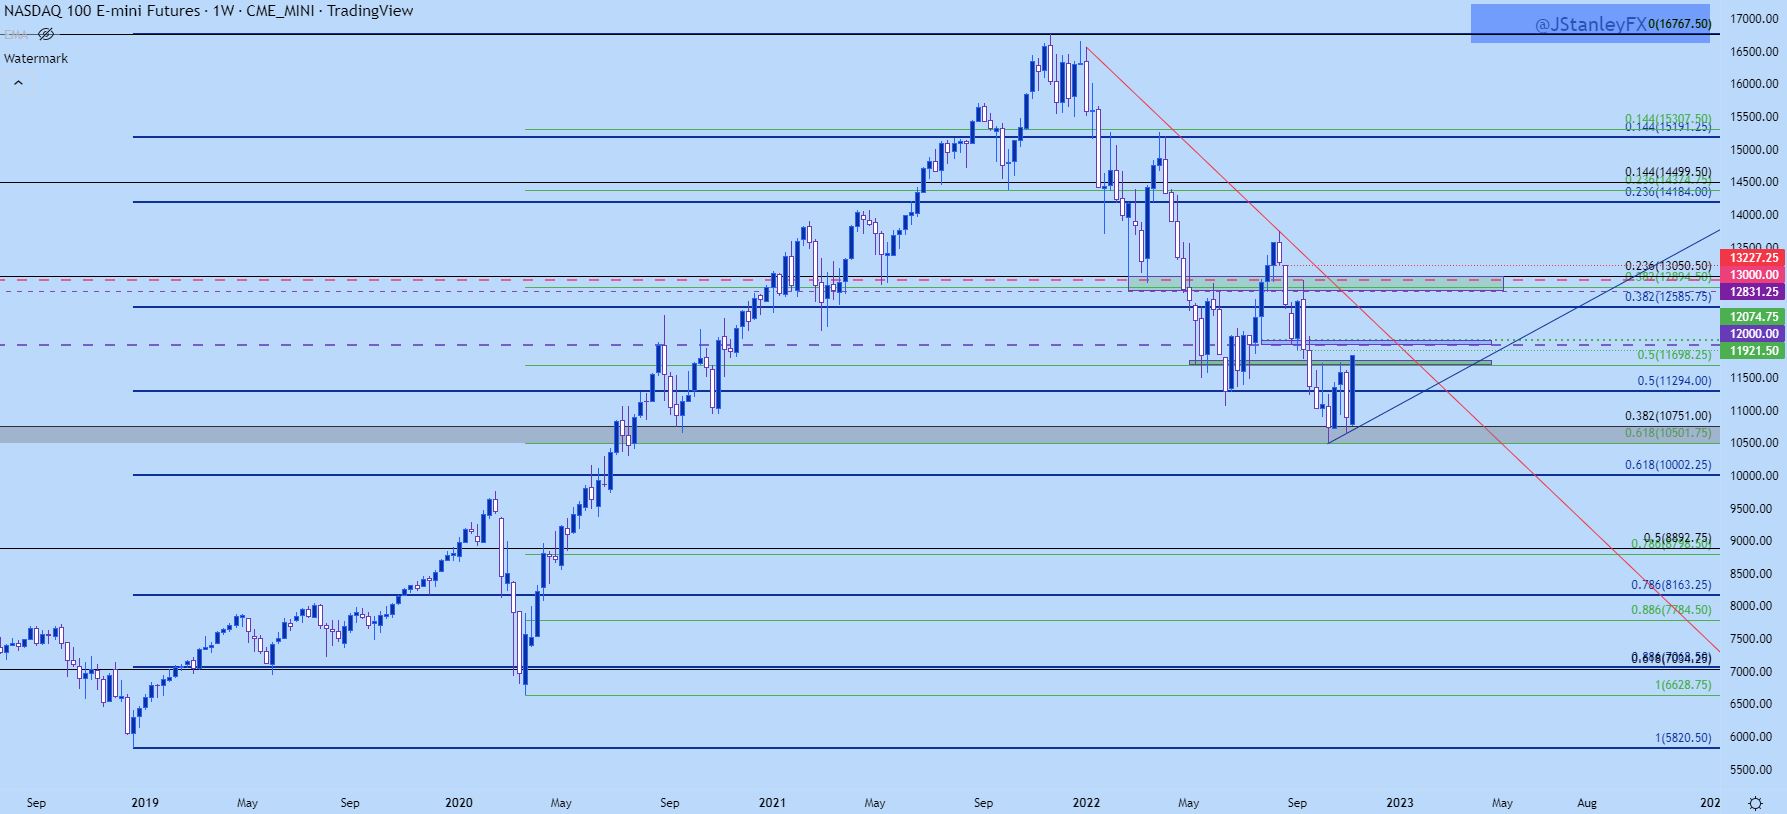
Chart prepared by James Stanley; Nasdaq 100 on Tradingview
Nasdaq Shorter-Term
From the daily chart, we can focus in on the wedge break. The resistance trendline is taken from August and September swing highs, the projection of which had caught the late-October high. Falling wedges are often tracked with the aim of bullish reversals, largely brought upon by the fact that sellers didn’t stretch price action upon tests of fresh lows, and that’s what we’ve seen with the minimal extension from the June low to the October low.
This puts focus on the longer-term trendline, in red below, which projects to around 12,600 in the Nasdaq 100 for next week.
Nasdaq Daily Chart
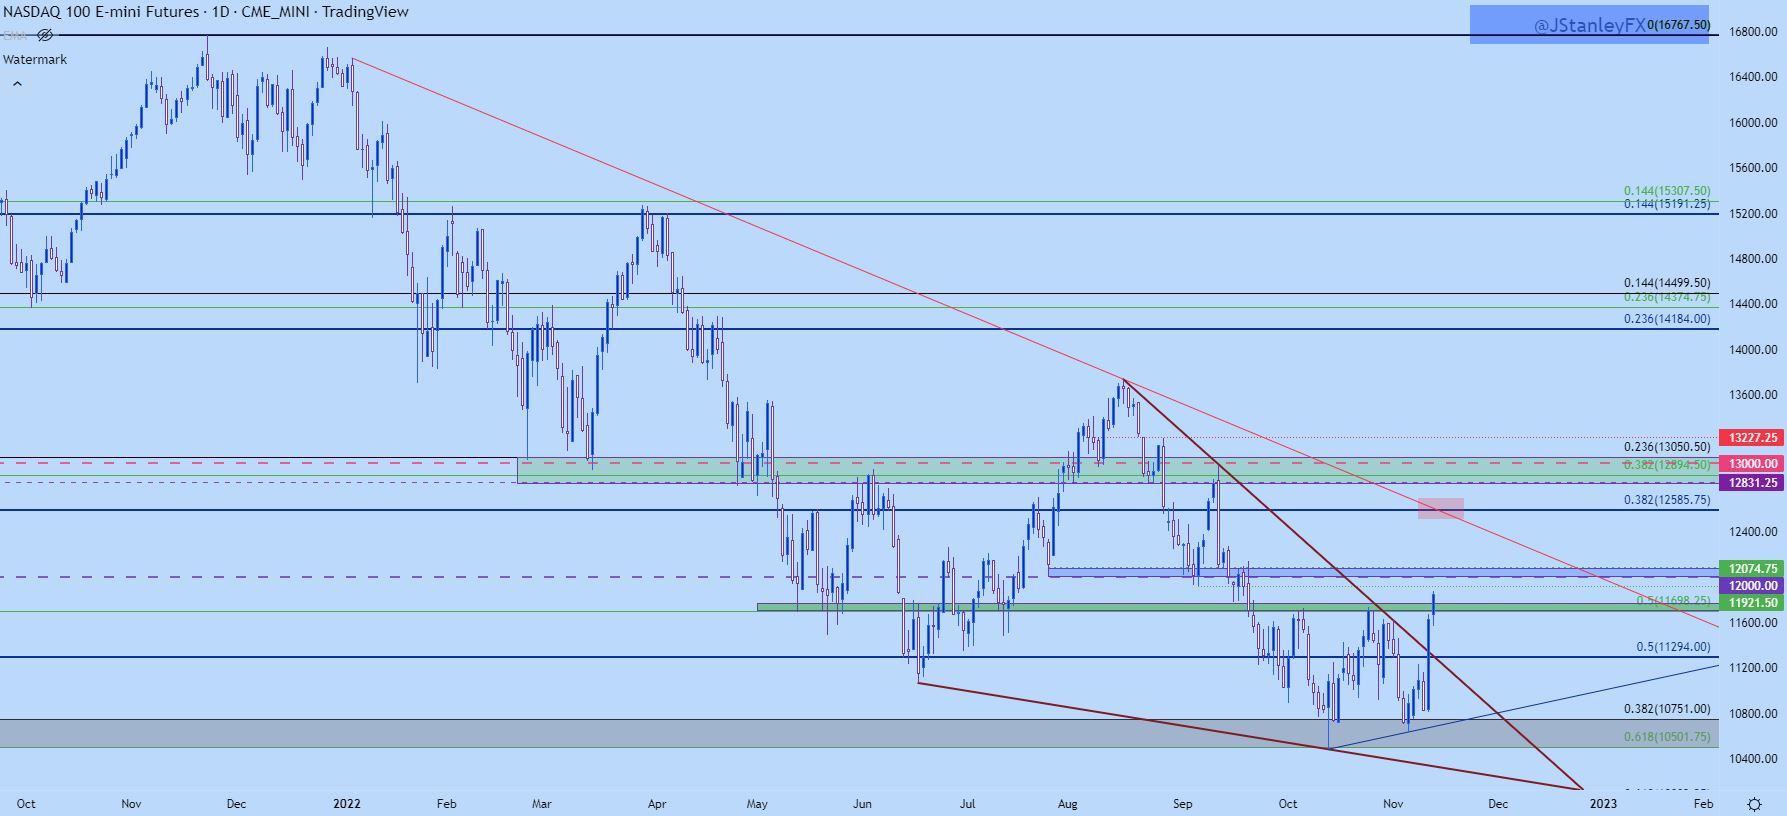
Chart prepared by James Stanley; Nasdaq 100 on Tradingview
S&P 500
The S&P 500 put in a rally to the 4k psychological level, and this a little less than a month after a big support test at 3500. But, similar to the Nasdaq, there was a falling wedge that had built off of that observation and that was broken-through last week on Thursday. And the prior week even had a wide open door for bears following a hold at that trendline and the build of a bearish engulfing pattern.
The fact that stocks not only didn’t continue that move lower, and instead put in a strong rally-higher speaks right to that phrase of ‘if stocks don’t sell-off on bad news, there’s probably something else going on.’
My guess on the ‘something else’ is sentiment-related, and that probably has something to do with options activity. Put-call ratios have had a tendency to widen out as prices push to lows, and those have been massive contrarian signals of late as market makers then have incentive to push prices-higher to capture that put premium. In my opinion, this explains why there’ve been so many short squeeze types of scenarios over the past few months, which has helped to lead to the build of those falling wedge formations. And, in-turn, it’s hindered the Fed’s plans to a degree.
But, it’s worth saying again, the chart doesn’t care about opinions and this fresh breakout has produced a higher-high after last week’s higher low.

S&P 500 Weekly Chart
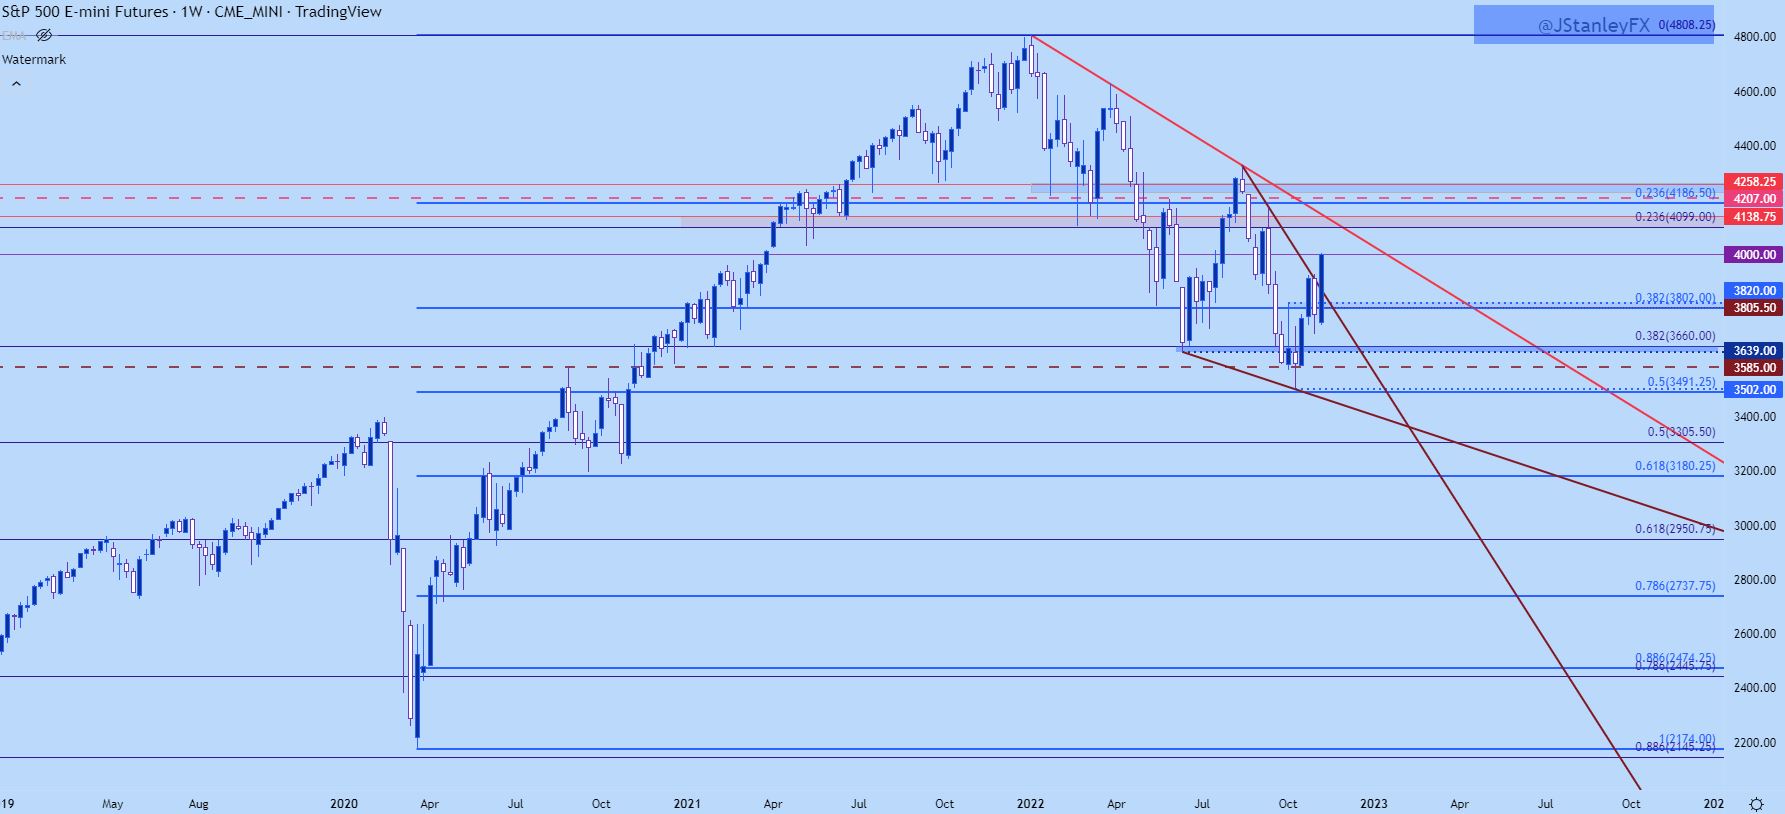
Chart prepared by James Stanley; S&P 500 on Tradingview
S&P Shorter-Term
On the below chart, we can focus in on that 4k resistance test which is helping to mark the current higher-high. This also opens up support potential at a key zone, spanning from 3802-3820, and that really just illustrates how aggressive last week’s bullish response was. Between current price and that zone is another area of possible higher-low support, and that plots around the 3900 handle.
On the topside of price action, there’s a bearish trendline that projects to the 4100-4139 zone for next week. Above that, a familiar area around the 4200 mark appears.
S&P 500 Daily Chart
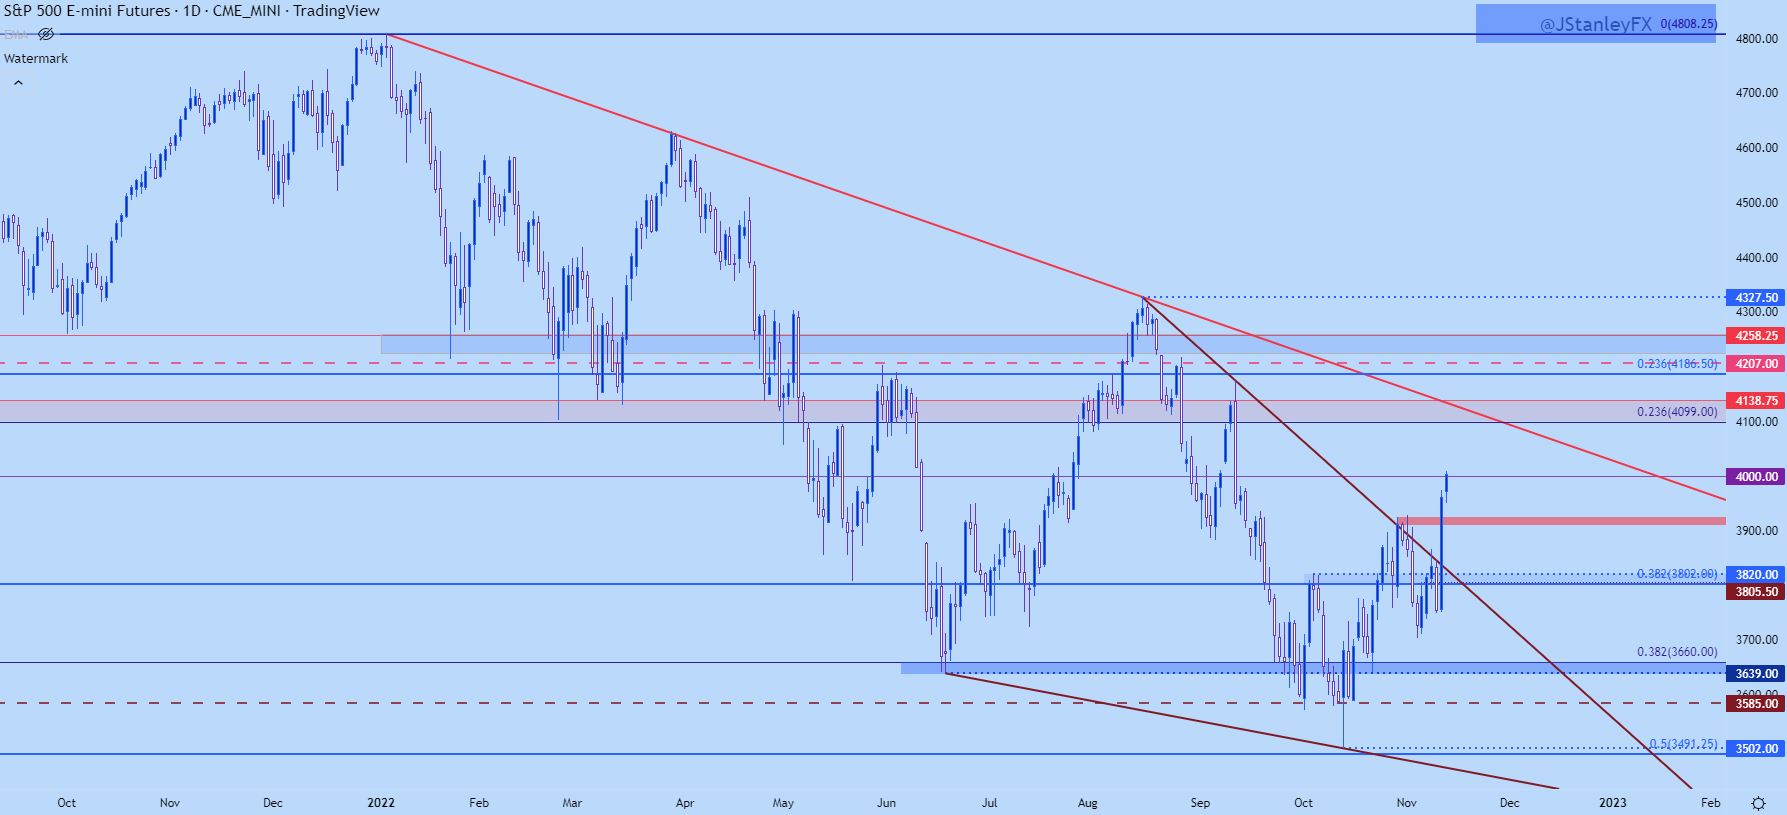
Chart prepared by James Stanley; S&P 500 on Tradingview
Dow Jones
The Dow was up as much as a whopping 18.67% from the October low last week. This outpaces the maximum move of 15.54% that showed in June, and notably, that was less than the Nasdaq’s 24% rally over the same period of time.
The fact that the Nasdaq had jumped more in June illustrates that this was probably short-covering-related. But, with the most recent iteration of bullish behavior, the fact that the Dow outpaced indicates that there was some legitimate bullish accumulation here. And if we look at the contextual backdrop of higher rates and the Fed talking up the prospect of holding rates in restrictive territory, it makes sense as to why the Dow would outperform: It’s less rate-sensitive than the tech-heavy Nasdaq.
But – the fact that the Nasdaq started to outpace both the Dow and S&P on Thursday and Friday of last week suggests that there may be some short-covering coming into the equation, and this is something that can be similarly impactful to both the Dow and the Nasdaq although it would probably have a greater impact on Nasdaq price action.
On a technical basis, the Dow took out a major trendline last week, which connected January and August swing-highs. An attempted pullback on Friday was cut short, as support showed up at the resistance swing from the August 26th high, further illustrating bullish behavior. The next major spot of resistance sitting overhead is around the August high, just inside of the 32,500 psychological level. There’s support potential at the same 33,444 level that came into play on Friday but there’s another zone that appears a bit more solid around 33,000-33,106.
Given the Friday doji, combined with the fact that the Dow has already put in a sizable move, caution is warranted here from chasing. But, establishment of higher-low support can keep the door open for bullish continuation scenarios.

Dow Daily Chart
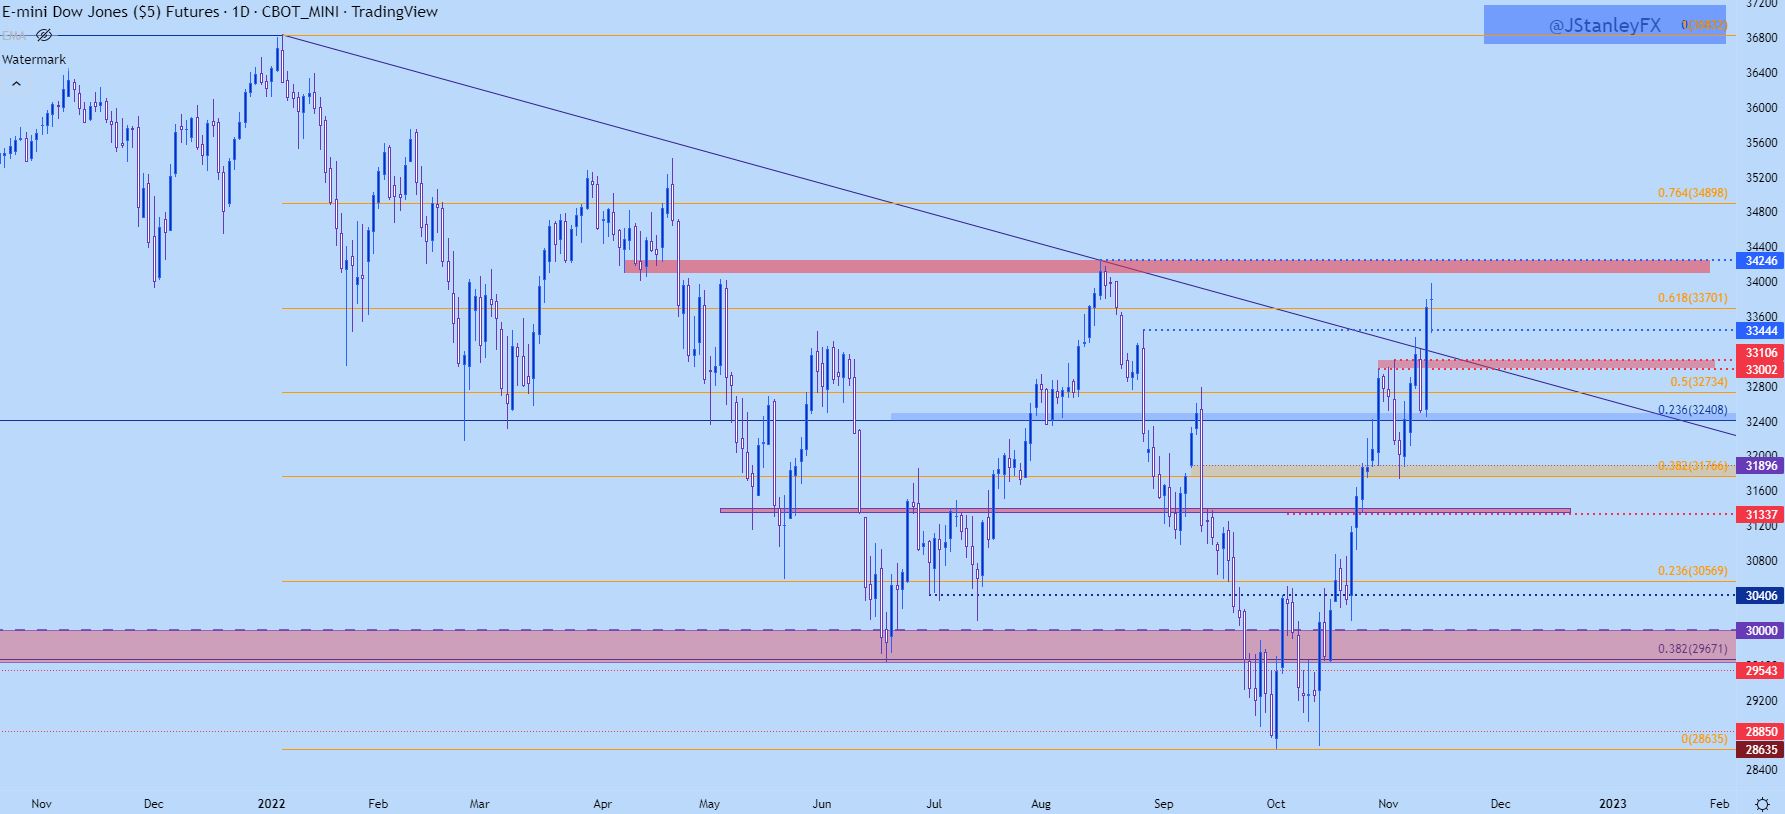
Chart prepared by James Stanley; Dow Jones on Tradingview
DAX
While US equities have been clawing back from the mid-October low, the DAX is now in a technical bull market after jumping by more than 20% from its October low.
And the move has priced-in very cleanly, too, with a longer-term falling wedge formation leading into a breakout around the ECB rate decision in late-October.
There was even a pullback, re-load setup here, when prices pulled back to wedge support, right at a confluent zone of Fibonacci levels after the FOMC rate decision. At this point, the move looks near-parabolic on the daily chart and this has tones of aggressive short-covering in the DAX. The index is up more than 10% from that low in the prior week, and it was already aggressively-bought before that higher-low showed up. This indicates greater unwind from longer-term short positions.
And this may have some relationship with larger themes around the Euro as fear continues to dissipate. While much of the summer was wrought with fear of what winter might bring, hopes have started to shift that Europe may be able to get through the winter without too much impact from the ongoing war in Ukraine. That, of course, remains to be seen, but the response in the DAX is notable and technically, the index is pushing into a fresh bull market with prices more than 20% over the prior October low.

DAX Weekly Chart

Chart prepared by James Stanley; DAX Futures on Tradingview
DAX Shorter-Term
The DAX has now crossed the 50% marker of the 2022 sell-off and that helps to keep the near-term focus on strength. That price is at 14,062, which can be spanned down to the August swing-high to create a support zone. A hold there keeps the door open for aggressive bullish strategies, but realistically, price can dip down to the 13,500 area and still retain a bullish look as the prior swing-low is all the way down around 13k.
On the topside of price action, the next major level is the 61.8% retracement of this year’s move at 14,589, after which a significant swing at support-turned-resistance appears at 14,909.
DAX Daily Chart

Chart prepared by James Stanley; DAX Futures on Tradingview
--- Written by James Stanley, Senior Strategist, DailyFX.com & Head of DailyFX Education
Contact and follow James on Twitter: @JStanleyFX


