


S&P 500, Credit Suisse, Dollar, USDJPY, ISM and NFPs Talking Points:
- The Market Perspective: USDJPY Bearish Below 141.50; Gold Bearish Below 1,680
- Wednesday’s New York session opened to a hefty gap lower for the S&P 500 – a move that broke the incredible pace to start the week
- The waver likely has more to do with a temporary seasonal run stalling out, which now puts fundamentals back into focus – which amplifies volatility and obscures a clear direction

S&P 500 Disruption and a Scramble for Fundamental Justification
The opening October and fourth quarter rally hit a serious road bump this past session; and as is common or those suffering a setback, here was a scramble for reasoning. I believe the stumble was a natural progression from a market not rooted in traditional fundamentals, but speculation can be its own motivation. For the perspective of ‘risk trends’, the S&P 500 extended its role as a leading benchmark with a modest -0.2 percent slip this past session. That isn’t a particularly large loss, but in contrast to the preceding two-day, 5.7 percent rally it is a serious disruption. The trouble began with a -1.0 percent gap to the downside on the open. This doesn’t register as a full-blown reversal of this week’s upswing, but it robs the market of its ability to rise speculative momentum and puts the onus on legitimate fundamentals. That can be a problem for nascent bullish interests. There is a reason that risk assets have slid through 2022: the fundamental outlook has deteriorated. It is certainly possible that we pick the bullish swing back up through the back half of this week, but it is likely to require a more concrete backdrop. And, we are struggling for any serious foundation of enthusiasm.
Chart of S&P 500 with Volume, 20-Day SMA and Opening Gaps (Daily)

Chart Created on Tradingview Platform
When it comes to this past session’s significant waver in speculative progress, there is a convoluted path that you could take to justify the swoon in scheduled event risk. The ADP private payrolls figure – the hype man for NFPs on Friday – came in slightly better than expectations. That can be seen as a reinforcement for the hawkish rate trajectory which find Fed Funds futures pricing in an approximate 70 percent probability of yet another 75bp rate hike at the early November FOMC meeting. After the open – and after the sizable bearish gap – the ISM service sector activity report for September managed to beat expectations (56.7 versus 56.0 expected) with a jump in the employment component. That doesn’t fully offset the threat of a recession ahead, but it seems to delay its onset. Representing the majority of US economic output, this report could reinforce the view that the Fed is marching towards rate hikes, but I don’t believe the fundamental impact reaches that far. For me, the seasonal tides around quarter end and quarter open have simply played through. With the thread on speculation broken, the attention now shifts to tangible fundamental cues – whether bullish or bearish.
Chart of S&P 500 Overlaid with ISM Manufacturing and Service Sector Activity (Monthly)
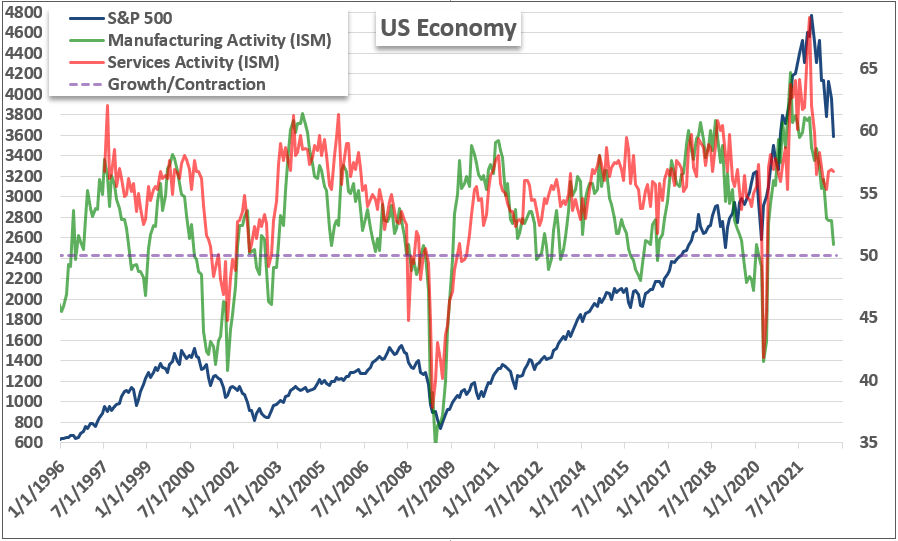
Chart Created by John Kicklighter with Data from ISM
Traditional Fundamentals Like NFPs and the Unorthodox Risks like Financial Threats
Looking out over the horizon, there is the event risk that tends to follow the more reliable fundamental courses – for which I will follow – but it is also important to monitor the potential ‘grey swans’. The very nature of ‘swan’s is that they are either known and considered very low probability (grey) or extreme impact and completely unexpected (black). Over the past week, there was plenty of talk around unofficial talks among Fed members stating concern about financial stability which seemed to draw on the headlines of Credit Suisse’s position. There were far too many references to ‘Lehman moment’ with this bank, but the exaggerated picture was not totally off in terms of the general concern. Despite the debunking of an imminent crisis for CS, credit default swaps (over five years) were still charging higher over the past few days. A charge in premium on default risks is not unique to Credit Suisse, but there are few tickers facing this intense a picture. We will weigh back in on this banking/financial sector pressure next week with the start of quarterly earnings which traditional starts with the banks.
Chart of Credit Suisse Stock Price Overlaid with 5-Year Credit Default Swap Rate (Daily)
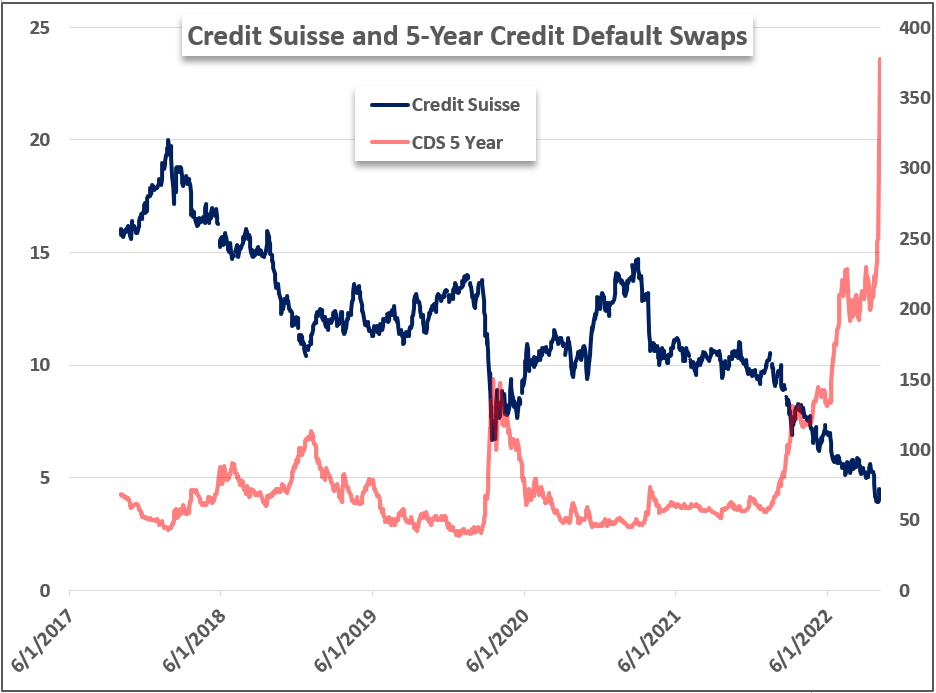
Chart Created by John Kicklighter with Data from ISM
Through more traditional fundamental channels, the docket is fairly heavy over the next 24 to final 48 hours of trade this week .Notably, this past session, the global monetary policy course seemed to downshift after the RBNZ hiked its benchmark rate 50 basis points – as expected – and the Kiwi Dollar still showed its struggle. That struggle from a typical carry currency was even more surprising than its Australian counterpart which seemed to fall short with a more reserved 25bp hike of its own Tuesday morning. Fed rate forecasting is still tipping towards yet another 75bp rate hike in a month’s time, but that forecast is just as exposed. Ahead, we have serious Fed official commentary from Loretta Mester, Charles Evans, Governor Lisa Cook, Governor Christopher Waller and Neel Kashkari on financial stability. There is serious potential in the reflection on growth, inflation and the tolerance levels of the US central bank. Adding to that, we have policy insights from the Bank of Japan and European Central Bank as well – principal counterparts to the Fed.
Critical Macro Event Risk on Global Economic Calendar for the Next 24 Hours
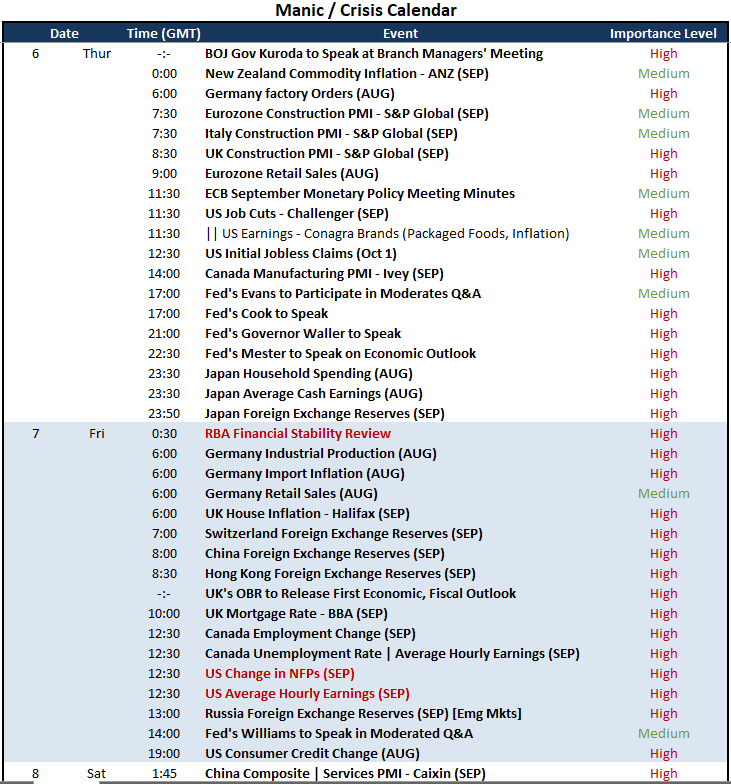
Calendar Created by John Kicklighter
The NFPs Will Draw Us Forward and USDJPY Represents Pressure
Fed speak is an important outlet for the Greenback and US indices, as a benchmark for risk trends. That said, the heaviest fundamental weight will likely draw on the gravity of Friday’s top event risk: the US nonfarm payrolls statistics. The FOMC has a dual mandate that targets steady inflation (approximately 2 percent) and as close to full employment as is feasible. Inflation is the problem to fix and labor market conditions reflects the tension on the hand break. As it stands, the outlook for Friday’s payrolls is wide open to a surprise from either the upside or downside. After the collapse in manufacturing labor conditions from the ISM along with the drop in job openings, the robust showing from the service sector ISM will give balance around the BLS number. The Thursday’s initial jobless claims and Challenger job cuts are also worthy of assessing.
Chart of Change in NFPs and ADP Private Payrolls with Differential (Monthly)
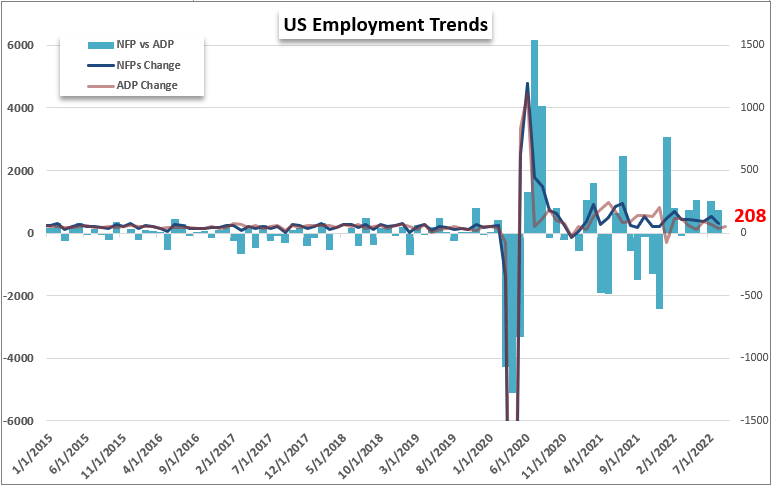
Chart Created by John Kicklighter with Data from BLS and ADP
When it comes to rate inflation, there are plenty of Dollar based crosses for which we can connect. For representatives of ‘risk trends’, there is an even larger watch list. That said, my interest for the Greenback, yield perspective and sentiment focuses on a far more interesting cross in USDJPY. There is a carry bias that continues to favor the Greenback but the Japanese ministry of finance has worked to cap the Yen’s depreciation (USDJPY gain) with direct intervention likely around the 145 level. These pressures remain in place, but we are in the midst of an uneasy armistice with the smallest six-day trading range from the pair in months. The chances of a break are high, but the direction depends on circumstance while follow through would draw on the fundamental depth.
{{GUIDE|HOW_TO_TRADE_USDJPY}}
Chart of USDJPY with 20-Day SMA and 6-Day Historical Range (Daily)
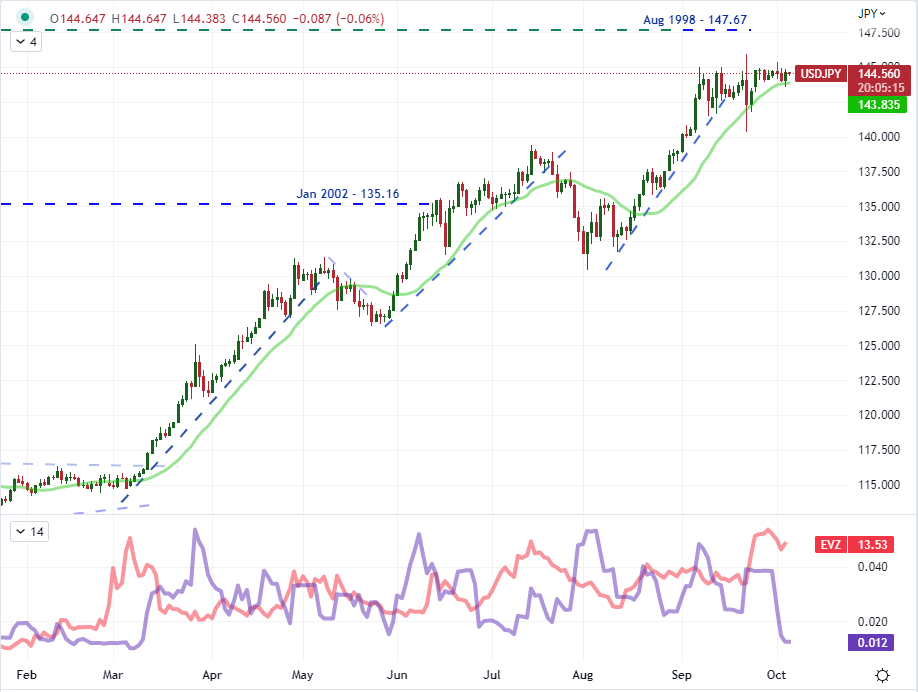
Chart Created on Tradingview Platform
Trade Smarter - Sign up for the DailyFX Newsletter
Receive timely and compelling market commentary from the DailyFX team


