

US Stocks Forecast: Neutral
- S&P 500 bull market emerges despite pessimistic economic outlook
- Nasdaq surges higher but remains in overbought territory
- FOMC likely to skip the June rate hike in favor of a wait and see approach
- The analysis in this article makes use of chart patterns and key support and resistance levels. For more information visit our comprehensive education library

S&P 500 Bull Market Emerges Despite Pessimistic Outlook
Next week the Fed releases its summary of economic projections which ought to shed some light on whether officials foresee an improvement in the economic landscape or not. Since the impressive performance in US tech-heavy indices like the S&P 500 and Nasdaq 100 can be attributed to only a few large cap stocks, the prognosis from the Fed is unlikely to reveal a significant change to prior figures.
Nevertheless, big tech continued the impressive run as Tesla was the outperformer at the open today as GM agreed to join Tesla’s EV charging network with Elon Musk’s company on track to mark an 11th straight day of gains. The gap higher at the open meant that the S&P 500 had technically entered a bull market. A 20% rise from the low is relied upon to denote such a feat. This year Nvidia and Meta had been leading the charge but now Tesla is attempting to bridge the gap to achieve even greater share price performance. The chart below shows the share price performance for the top tech stocks this year. Microsoft is currently the lowest at a very impressive 35% YTD.
US Tech Stocks YTD Performance
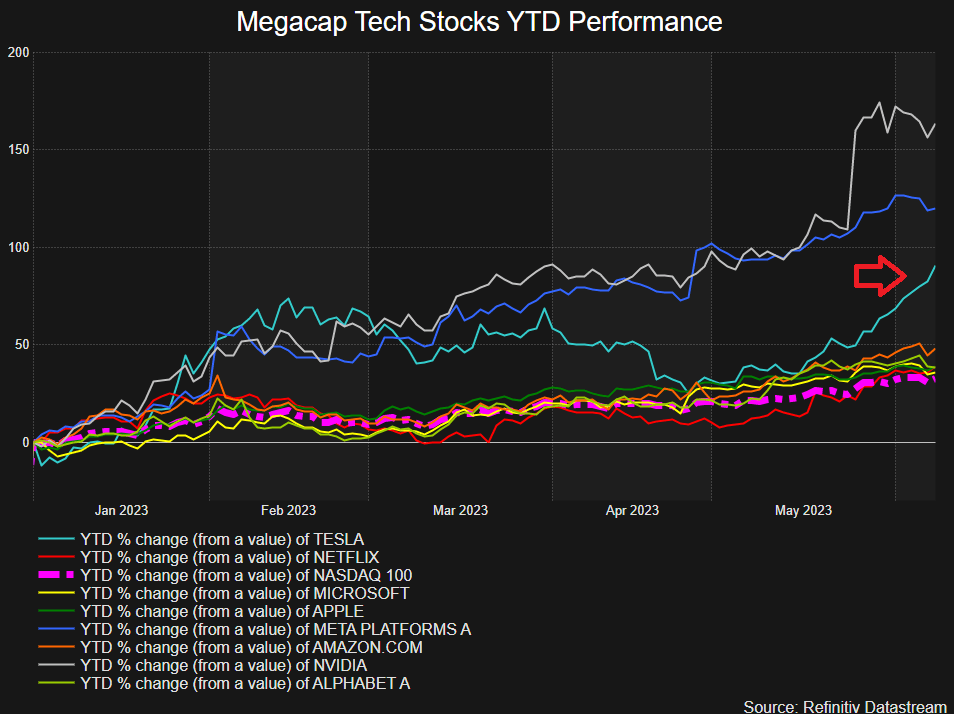
Source: Refinitiv, prepared by Richard Snow
S&P 500 Thrust into a Bull Market: Neutral
The neutral outlook provided is due to the nature of the advance witnessed over the last 3-4 weeks where little by way of a pullback was present and US equities are beginning to look overbought. On the other hand, complicating the weekly outlook, US core inflation data has an opportunity to print lower at a time the Fed is likely to skip the June hike, which could bolster equity valuations further.
The S&P 500 continues to defy markets with its continued bullish momentum. The index now enters a bull market as the Fed contemplates a pause to rate hikes in Q3. What’s more, if US inflation reveals a dip in core inflation below the stubborn 5.5% level, the index could garner more support as the implication of lower inflation is that rates may not have to stay elevated for as long as originally anticipated.
The chart below is the E-Mini Futures which has surpassed the 20% mark but reveals much of the same sentiment as the cash index. Prices currently trade above the August swing high of 4327.50 without a sign of a pullback. A weekly close above this level leaves the index with a whole lot of room to gallop as the next significant level of resistance is all the way up at 4550. Support resides at the zone around 4230.
S&P 500 E-Mini Futures (ES1!) Weekly Chart
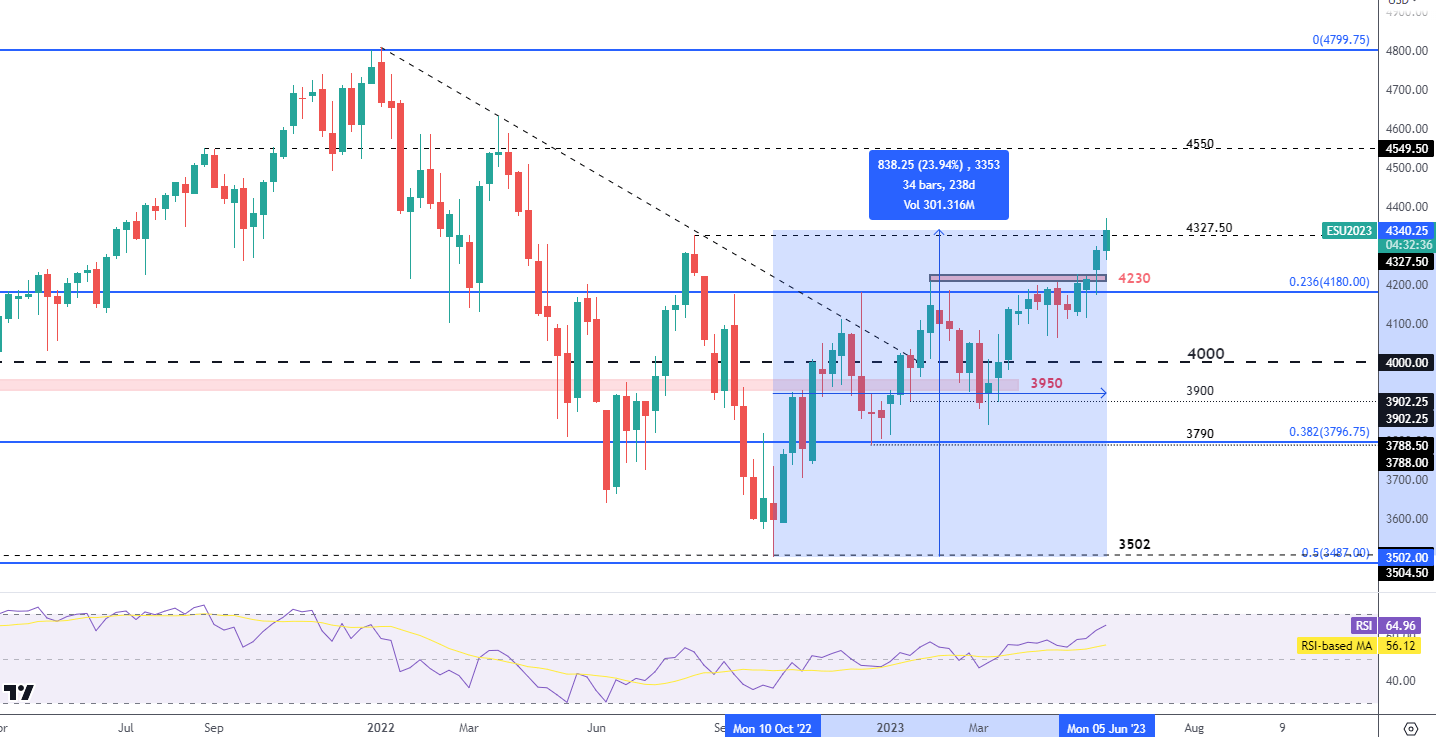
Source: TradingView, prepared by Richard Snow
Nasdaq’s Surge Keeps it Firmly Placed in Overbought Territory: Neutral
The weekly chart shows the relentless rise of the tech-focused Nasdaq, which, according to the RSI, is well into overbought territory currently. The ascending channel revealed with the help of a pitchfork helps to identify a potential point of resistance to the current move, the upper parallel line (circled in red) where prices failed to push on previously.
A move below the median line and the 61.8% Fibonacci retracement of the 2021-2022 major decline at 14,367 may see a return from overbought conditions but this remains to be seen as US stocks continue to see a strong push to end prior weeks. Should stocks continue higher, 15,260 comes into focus at the next level of resistance, corresponding with the Jan and March 2022 highs
Nasdaq (NQ1!) Weekly Chart
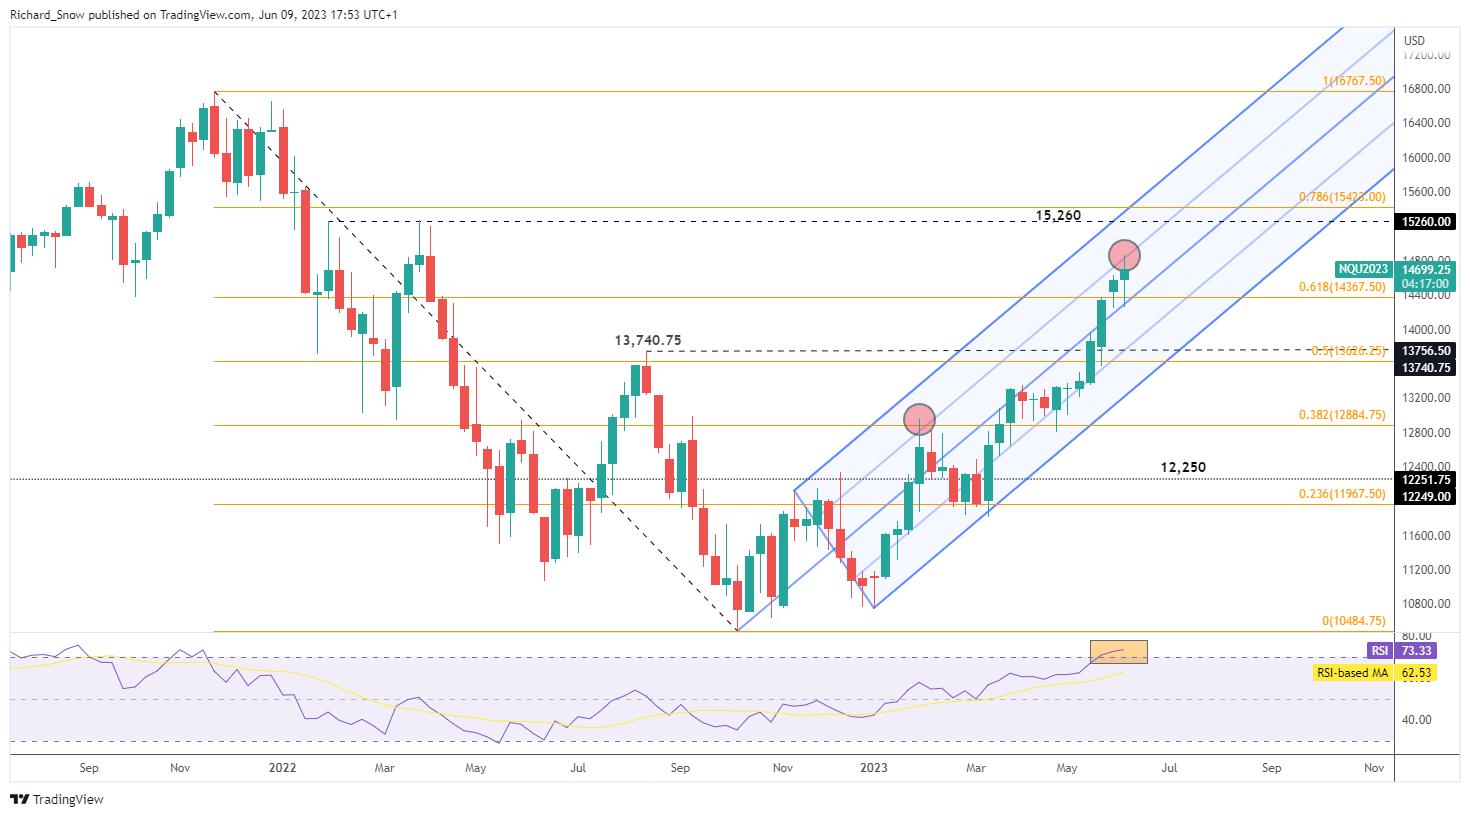
Source: TradingView, prepared by Richard Snow
Trade Smarter - Sign up for the DailyFX Newsletter
Receive timely and compelling market commentary from the DailyFX team
--- Written by Richard Snow for DailyFX.com
Contact and follow Richard on Twitter: @RichardSnowFX