


S&P 500, Dow Jones, Nasdaq 100, Japanese Yen, BoJ – Asia Pacific Market Open
- S&P 500, Dow Jones and Nasdaq 100 sink as Treasury yields rally
- Markets priced in more hawkish Fed, leaving APAC equities at risk
- S&P 500 continues Rising Wedge breakout, hinting at further losses

Asia-Pacific Market Briefing – Wall Street Volatility Leaves APAC Markets Bracing
Volatility was the theme to start off the new trading week. By the end of Monday’s Wall Street trading session, the S&P 500, Dow Jones and Nasdaq 100 sank -0.9%, -0.5% and -1.5%, respectively. This brought the indices down to their lowest levels since November 10th. Wall Street’s performance also showed that the relatively high-beta tech sector was disproportionately impacted.
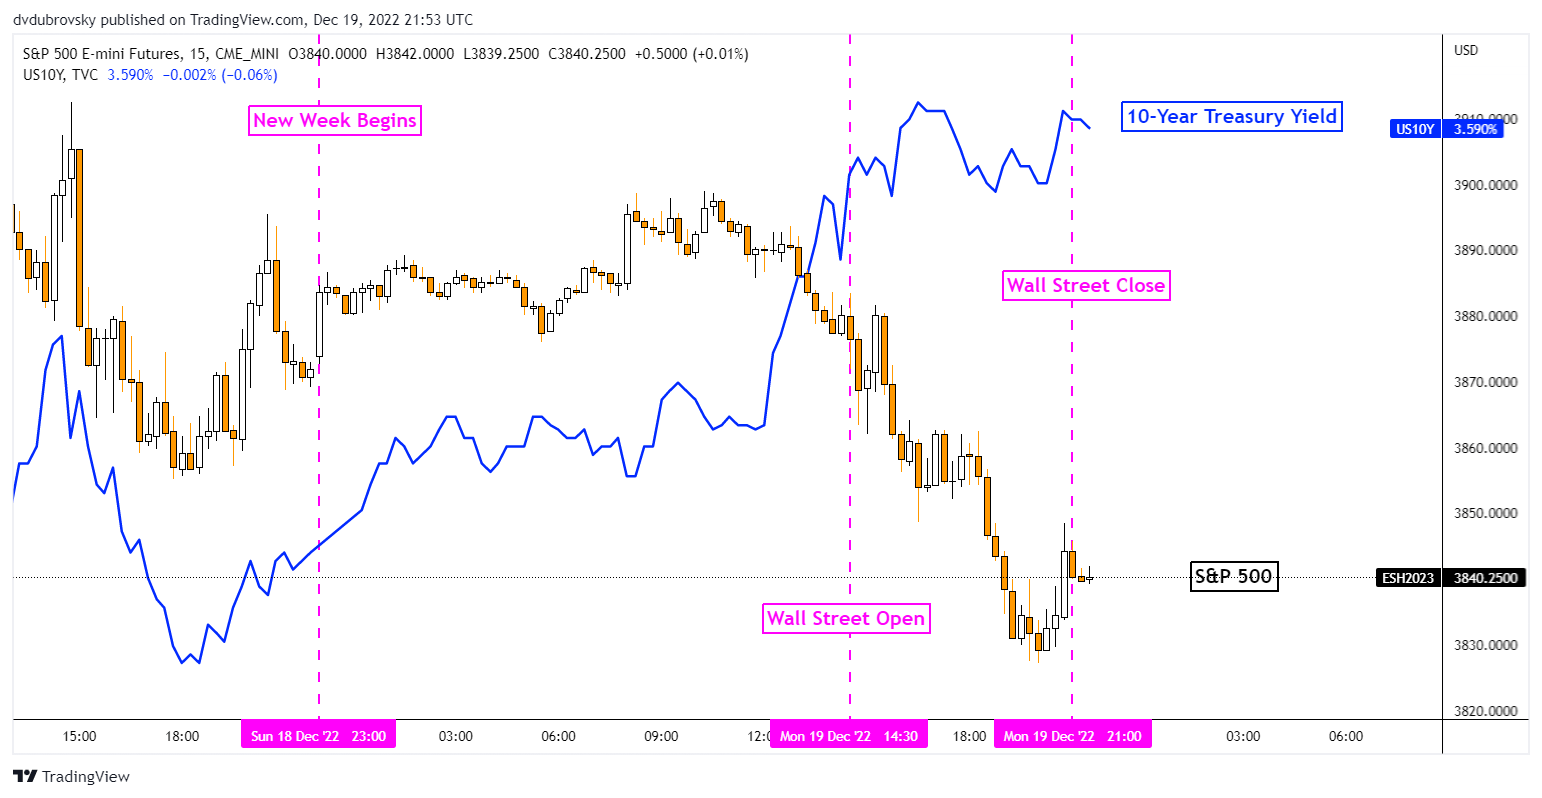
A look at the 15-minute chart below shows that the S&P 500 was inversely tracking the 10-year Treasury yield. In fact, the latter gained about 2.9% in the best single-day performance since October 19th. Front-end yields also climbed, signaling that the move in bond markets seemed to have been tied to markets pricing in a more hawkish Federal Reserve.
This was despite notable economic event risk during the Wall Street trading session. Rather, the move might have been an extension of price action last week. Over the past 5 trading sessions, we saw central banks such as the Fed, ECB, and BoE tighten. They also hinted at further rate hikes to come, especially from the European Central Bank.
If you looked at the Fed’s projection for interest rates after last week’s policy announcement, you found that it was more aggressive than what the market was pricing in. As anticipated, it seems that this divergence opened the door to volatility. Considering this, it remains reasonable to foresee that the tech-heavy Nasdaq 100 may remain more vulnerable ahead.
S&P 500 Futures Versus Treasury Yields on Monday
Tuesday’s Asia Pacific Trading Session – Eyes on the Bank of Japan, Sentiment
Tuesday’s Asia-Pacific trading session carries the Bank of Japan interest rate decision. The BoJ does not have a set time release, but occurrences since 2020 show that the likely outcome is between 2:45 – 3:15 GMT. Regardless, the central bank is widely anticipated to stand put and the Japanese Yen will likely remain more sensitive to developments abroad influencing its direction.
More worryingly, Wall Street’s risk aversion could spread into Tuesday’s APAC session. That is leaving indices like the ASX 200, Nikkei 225 and Hang Seng Index at risk. A further deterioration in sentiment may also bode well for the haven-linked US Dollar. Meanwhile, the risk-sensitive Australian and New Zealand Dollars could weaken.
S&P 500 Technical Analysis
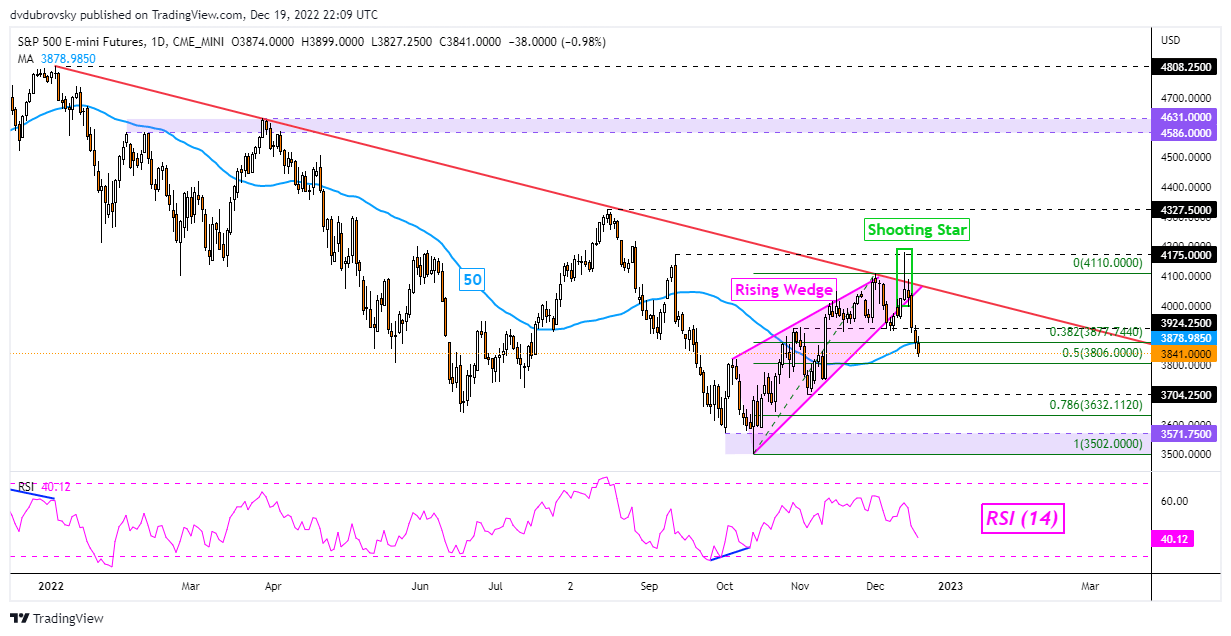
The S&P 500 continued its breakout under a bearish Rising Wedge chart formation, opening the door to extending the broader downtrend since earlier this year. On Monday, prices broke under the 50-day Simple Moving Average (SMA), further underscoring downside momentum. Immediate support is the midpoint of the Fibonacci retracement at 3806.

S&P 500 Futures Daily Chart
--- Written by Daniel Dubrovsky, Senior Strategist for DailyFX.com
To contact Daniel, follow him on Twitter:@ddubrovskyFX


