


S&P 500, Dollar, USDJPY, CPI and Earnings Talking Points:
- The Market Perspective: USDJPY Bearish Below 141.50; Gold Bearish Below 1,680
- US core CPI accelerated to a four-decade high 6.6.percent clip this past session; nevertheless, the S&P 500 turned a large bearish gap into a day’s rally on the biggest range since March 2020
- Volatility is the principal undercurrent in the market’s inflation response, and elevated market activity faces further key events like the BOE’s stimulus expiration and US consumer sentiment data

The S&P 500’s Biggest Range Since the Pandemic and a Gain that Defies CPI
The market’s ultimate response to the September US inflation report doesn’t exactly line up to traditional fundamental lines that we have come to expect when it comes to this important data series. There are plenty of explanations being floated to try and rationalize the swell from the S&P 500 and other risk-leaning assets this past session, but I believe the critical take away from the session was the volatility that was ultimately expressed. Fundamentals are a matter of priority and more systemic market conditions can warp the interpretation. I have a saying: volatility begets more volatility. Through Thursday’s trading session, the US equity index initially responded to the US inflation report with a sharp -1.6 percent gap to the downside on the open with a test of 50 percent retracement of the post-pandemic rally around 3,505 . However, the day ultimately closed with a 2.6 percent gain. That ultimately accounted for the biggest single-day trading range for the SPX (5.5 percent) since March 2020. With the 20-day simple moving average and upper channel threshold overhead, it will be interesting to see how volatility is directed moving forward.
Chart of S&P 500 with 20-Day SMA and 1-Day Range as Percentage of Spot (Daily)
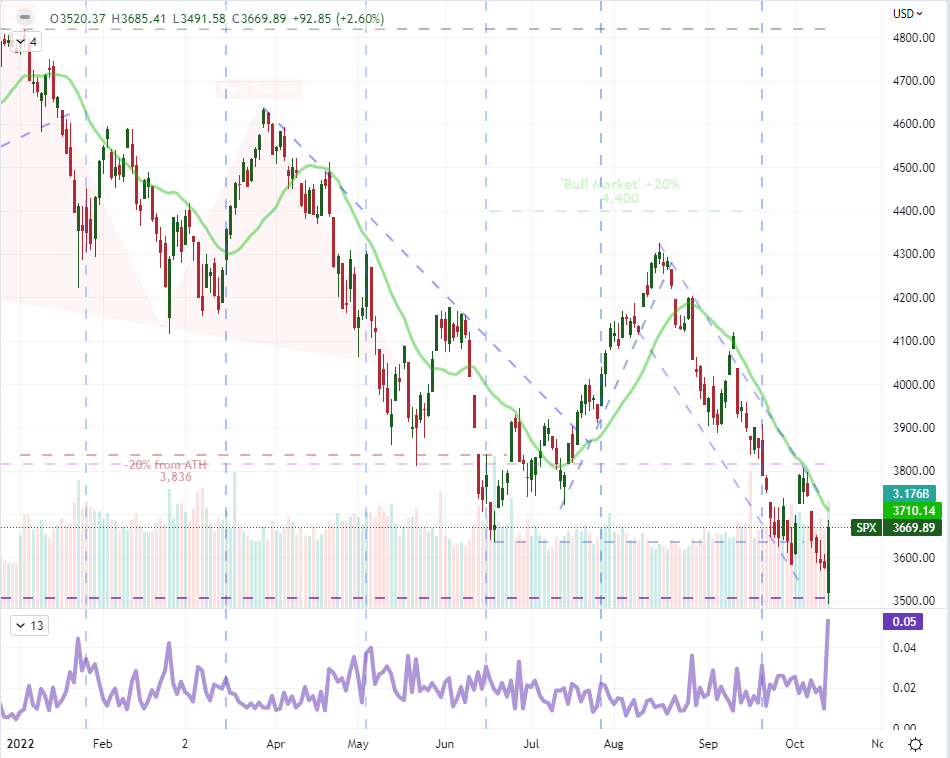
Chart Created on Tradingview Platform
What is remarkable to any fundamental market observer is that this past session’s impressive risk-oriented market gain comes in the wake of a faster than expected 6.6 percent core inflation reading. That is the hottest reading of price pressures for the market’s most closely observed gauge since the early 1980s. Under ‘normal’ circumstances, such a reading would be a further detriment to risk taking. The course of logic is that higher inflation would pressure the Federal Reserve to keep a fast pace of monetary policy tightening which in turn tightens the financial system and thereby undercuts the speculative favorites like equities. Indeed, the forecast for the Fed’s November 2nd FOMC meeting is fully pricing in a 75 basis point rate hike – what would be the fourth consecutive move of that magnitude from the world’s largest central bank. Given that Fed forecasts and rhetoric has suggested this was the probable course for some weeks and the IMF has reinforced the troubled economic outlook, it is not exactly a surprise. However, I don’t see that as a strong foundation for a market rally. As such, traders should be wary of continued volatility and a unpredictable view around direction.
Chart of US Consumer and Core Consumer Inflation (Monthly)
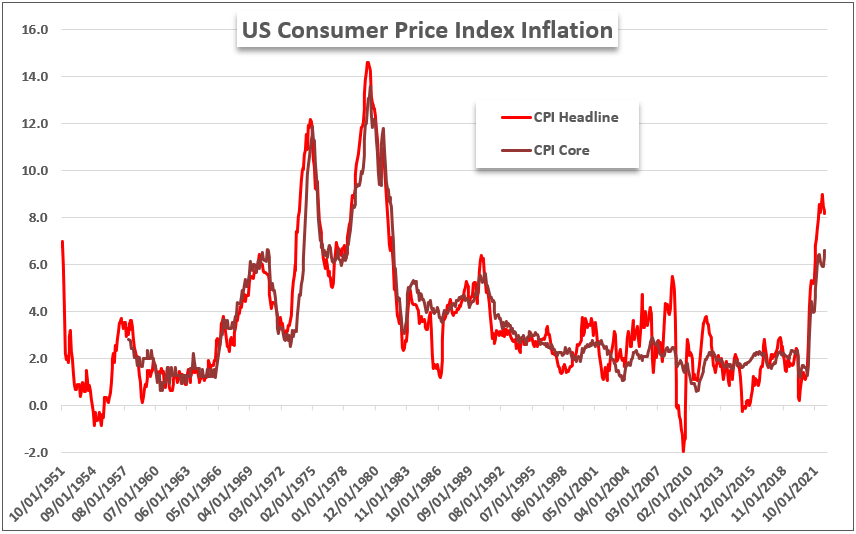
Chart Created by John Kicklighter with Data from the BLS
The Seasonal Expectations and a Defiant USDJPY
For those that have kept tabs on seasonal trends, the surge in volatility shouldn’t come as a surprise. Historically, the month of October has historically represented the peak of activity in both the measure of market oscillation and in terms of volume (as measured through the S&P 500). We are certainly measuring up to that norm this past session with S&P 500 volume also registering an impressive swell of its own. Yet, where my skepticism kicks in is the norms for the underlying index’s performance. The dispersion of directional market activity is broad and ultimate bearing depends heavily on the circumstances of the market in the given year. Historically, this month has averaged a gain for the SPX, but the backdrop should certainly call into question the directional aspirations. Consider, the market has been seen losses in six of the past nine months of 2022 thus far, and only one of those has historically averaged a loss back to 1980.
Chart of Average S&P 500, Volume and Volatility by Month
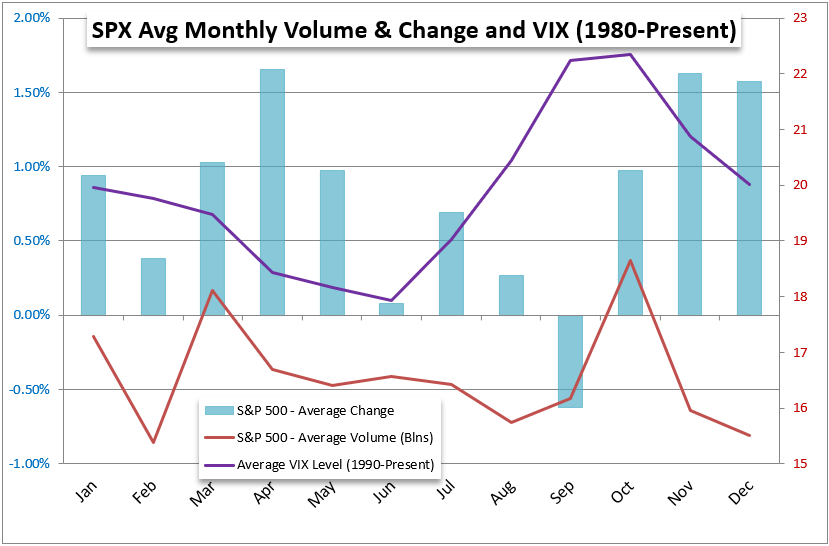
Chart Created by John Kicklighter
In an interesting harmony to the defiance of the US equity index, the Greenback would also register a controversial performance after the inflation report. With interest rate expectations for the Fed picking up and the implications for financial risks rising, it would stand to reason that the US currency would be expected to gain. It wouldn’t exactly out of pace to extend a well-establish bull trend a little further; but that isn’t the outcome with which we ultimately faced. The Dollar dropped against the Euro, Pound and commodity currencies this past session. It does little to alter our bigger picture standing of the benchmark’s progress towards multi-decade highs, but it is discombobulating. One area where the Dollar didn’t give ground – much to the chagrin of the Japanese authorities – was USDJPY. The exchange rate climbed for a painful 7th consecutive session and tagged the same high established back in August 1998 (147.67). We have certainly cleared the zone where the Japanese Ministry of Finance directed intervention in a bid to prop up the Yen back on September 22nd, and the market’s rejection of the effort is hard to miss.

Chart of USDJPY with 20-Day SMA and Consecutive Candle Count (Daily)
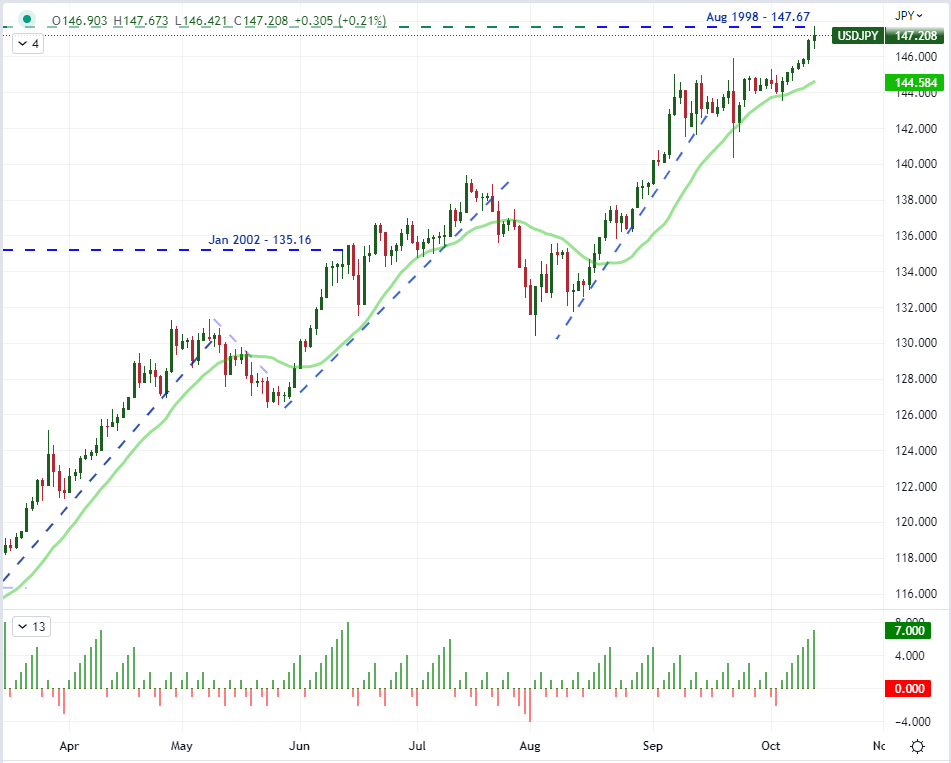
Chart Created on Tradingview Platform
Be Wary of Volatility on Key Event Risk Ahead Including: BOE Liquidity; Earning and US Sentiment
Volatility tends to build on itself naturally in a market, but a pointed list of high-profile scheduled event risk certainly helps to squeeze more activity. Looking out over Friday’s docket, there ware some serious events on tap that are more than capable of generating their own volatility. In a more traditional, macroeconomic channel, the US docket’s US retail sales report for September is a good check-in on economic health, but it is the University of Michigan consumer confidence survey for October which has the forward looking element. Should these figures disappoint, it will add weight to the IMF’s unflattering growth forecast for the world’s largest economy and only amplify the pain from the Fed’s commitment to combat inflation at the expense of expansion. In a significant shift in focus, the earnings season will begin in earnest Friday. We had the TSM and Blackrock corporate figures this past session which offer much support big picture, but there is a more concerted picture of the financial system due later today. It starts with JPMorgan which tends to set the tone, but be mindful of the differences in the major banks reporting – such as Wells Fargo’s reflection of housing finance and Citigroup’s insight on retail banking.
Critical Macro Event Risk on Global Economic Calendar for the Next 48 Hours
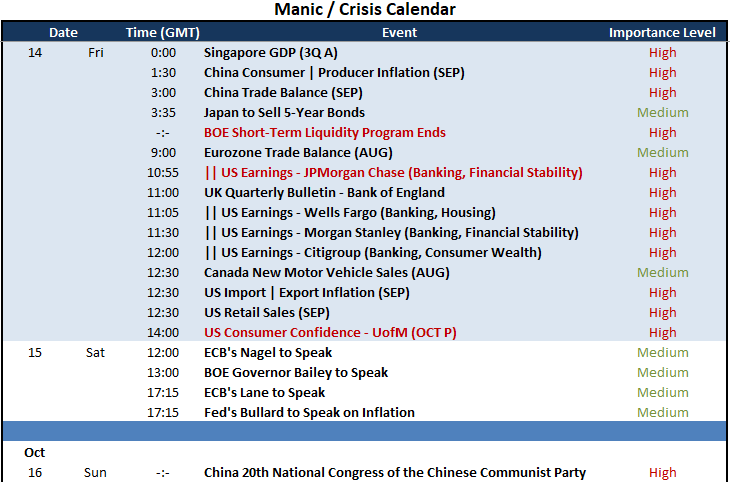
Calendar Created by John Kicklighter
Another interesting focus in the fundamental spectrum over the final trading session of the week is the proposed end of the Bank of England’s (BOE) short-term stimulus program. The central bank introduced a liquidity scheme in response to the nasty reaction to Prime Minister Liz Truss’s and Chancellor Kwasi Kwarteng’s mini-budget. Concern remains for the debt impact to the pricy package, but the BOE has made clear that it would be letting is extraordinary program expire on time Friday. While the 10 year Gilt yield retreated this past session, we are still exceptionally high. Either the central bank or the government will need to blink, or the market may ultimately bear the lack of coordination. Certainly watch GBPUSD and Sterling crosses closely on Friday.
Chart of GBPUSD with 50 and 100-Day SMAs, 1-Day Rate of Change (Daily)
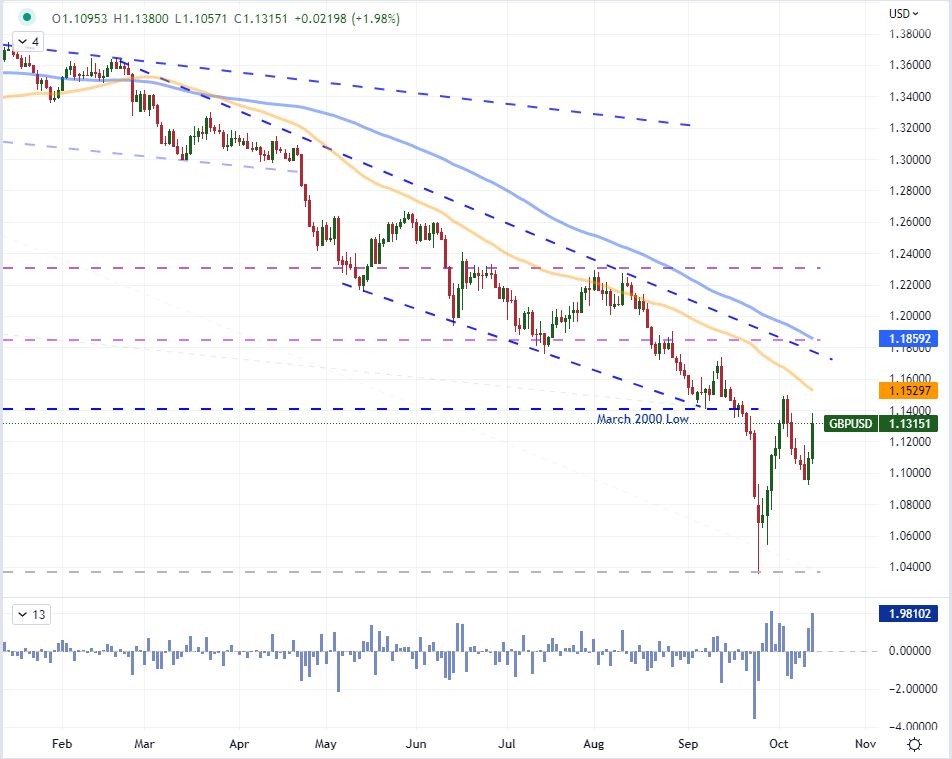
Chart Created on Tradingview Platform
Trade Smarter - Sign up for the DailyFX Newsletter
Receive timely and compelling market commentary from the DailyFX team


