


Oil’s price action in 2022 was one massive doji…
Price opened the year near a very key price on the chart of $75/barrel. There’s some historical context there, as well, with that price coming in as resistance in 2006 and, since then, operating as somewhat of a mid-point in the range of prices for Oil. And for 2022, this level was the basis for the build of that doji.
WTI Crude Oil (Yearly Chart)
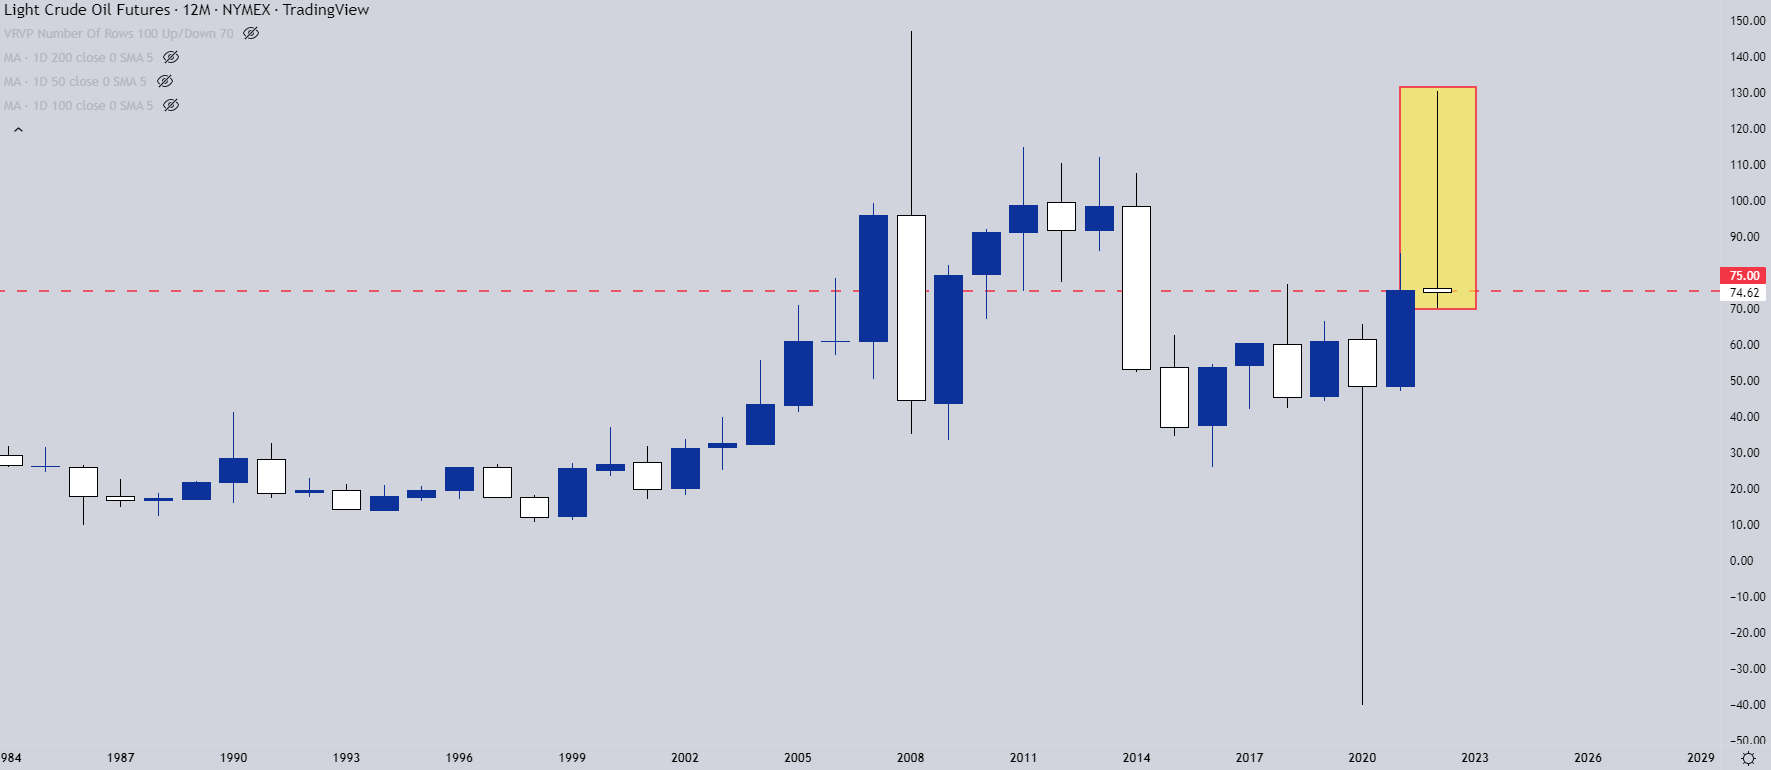
Source TradingView, chart prepared by James Stanley
This same spot offered support in 2011, and then was back in as resistance over a five-month-period in 2018, helping to set the high before the collapse-move in April of 2020. And when bulls were pushing prices back-up, $75 came in as resistance in July of 2021, and that helped to hold the highs in Oil into the end of last year. This is a massive level for WTI Crude Oil and has been for 14 years now.
When this year opened, a new risk factor began to flare and this was pertinent to Oil. Russia invaded Ukraine, and this put pressure on global supplies as prices ramped aggressively until, eventually, we had a fresh 13-year-high at the $130 handle. This made an already bad situation demonstrably worse, with inflation already proving problematic. And the flow-through of inflation via oil prices can be daunting, as almost every product on a shelf in the United States has to be transported and higher oil prices mean a higher cost of transporting those products.
This allowed for enough political motivation to open the Strategic Petroleum Reserve which helped to bring prices back down.
So, if we look at oil prices in 2022, it’s really a story of two trends: The rally from $75 up to $130 as war and fear were flaring. This took the first five months of the year with the high in March with a lower-high printing in May. And then for the second-half of the year, prices retreated right back down to $75 as the SPR pushed supply into the market.
But, as we near the 2023 open, the big question is whether sellers can get much run below that $75 level – especially considering that the US now needs to replenish the SPR.
WTI Crude Oil (Monthly Chart)
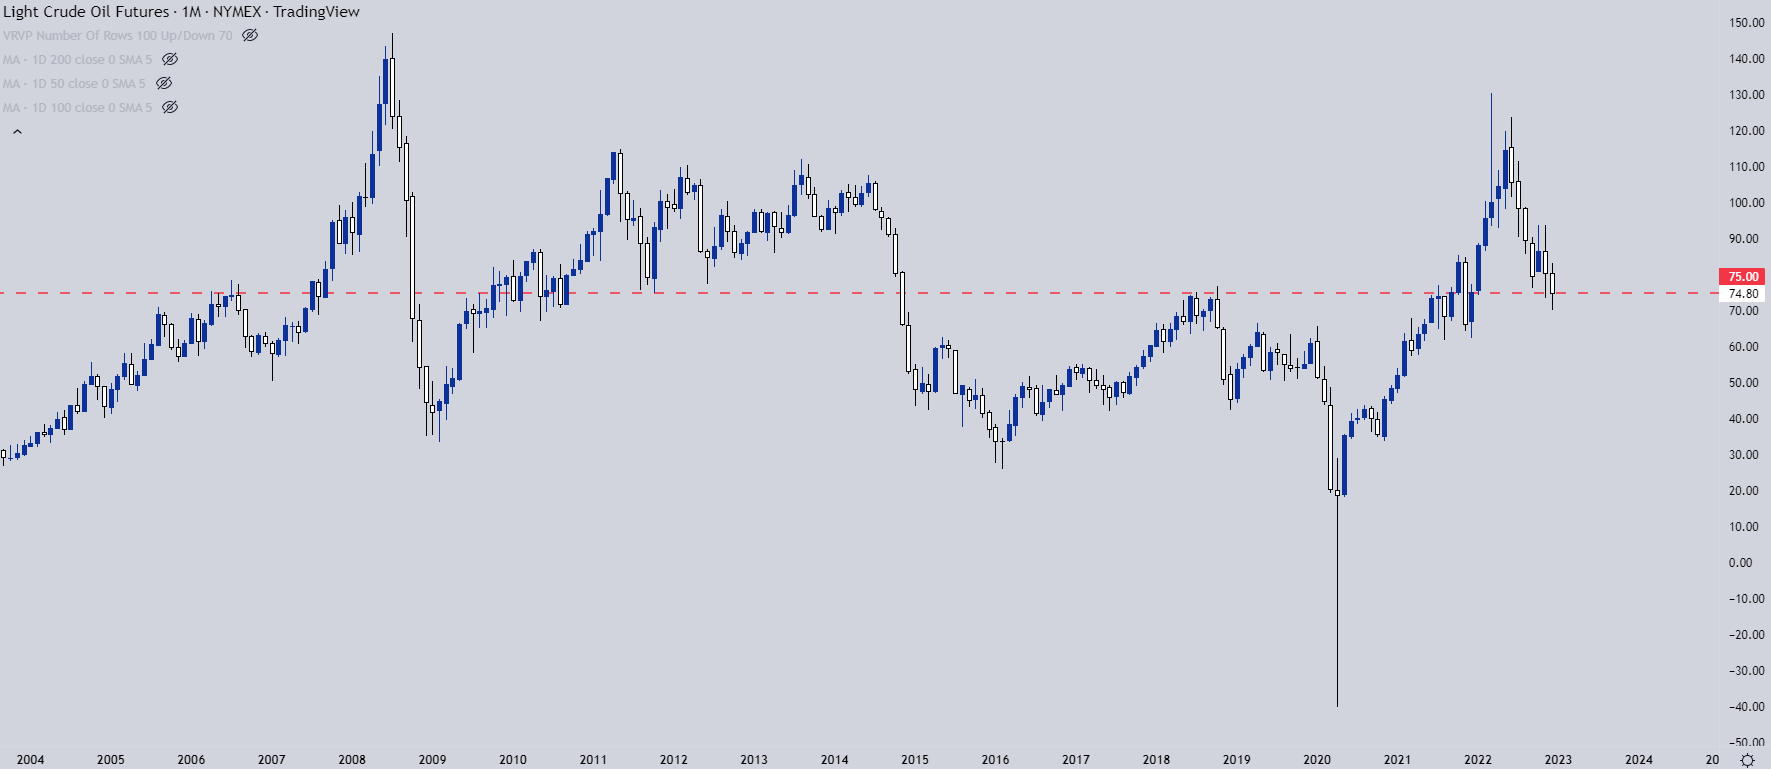
Source TradingView, chart prepared by James Stanley
Technical Forecast: Neutral but Bullish Potential
After hitting that high in March of this year, price pushed lower but retained a sense of consolidation, as that sell-off showed in the shape of a falling wedge. The formation is likely due to that $75 support level, as buyers posed a bounce in September and a support hold in November, thereby softening the sell-off at lows while bears continued to hit oil prices at highs or near resistance.
Falling wedges are often approached with the aim of bullish reversals and this can keep the door open for such in crude oil in Q1, 2023.
With that said, there’s still no evidence yet of the bearish trend having completed. And given the expectation for demand concerns, there’s also a fundamental case that could push the short-side a bit longer until bulls finally are able to re-take control.
The technical forecast for crude oil will be set to neutral for Q1.
WTI Crude Oil (Weekly Chart)
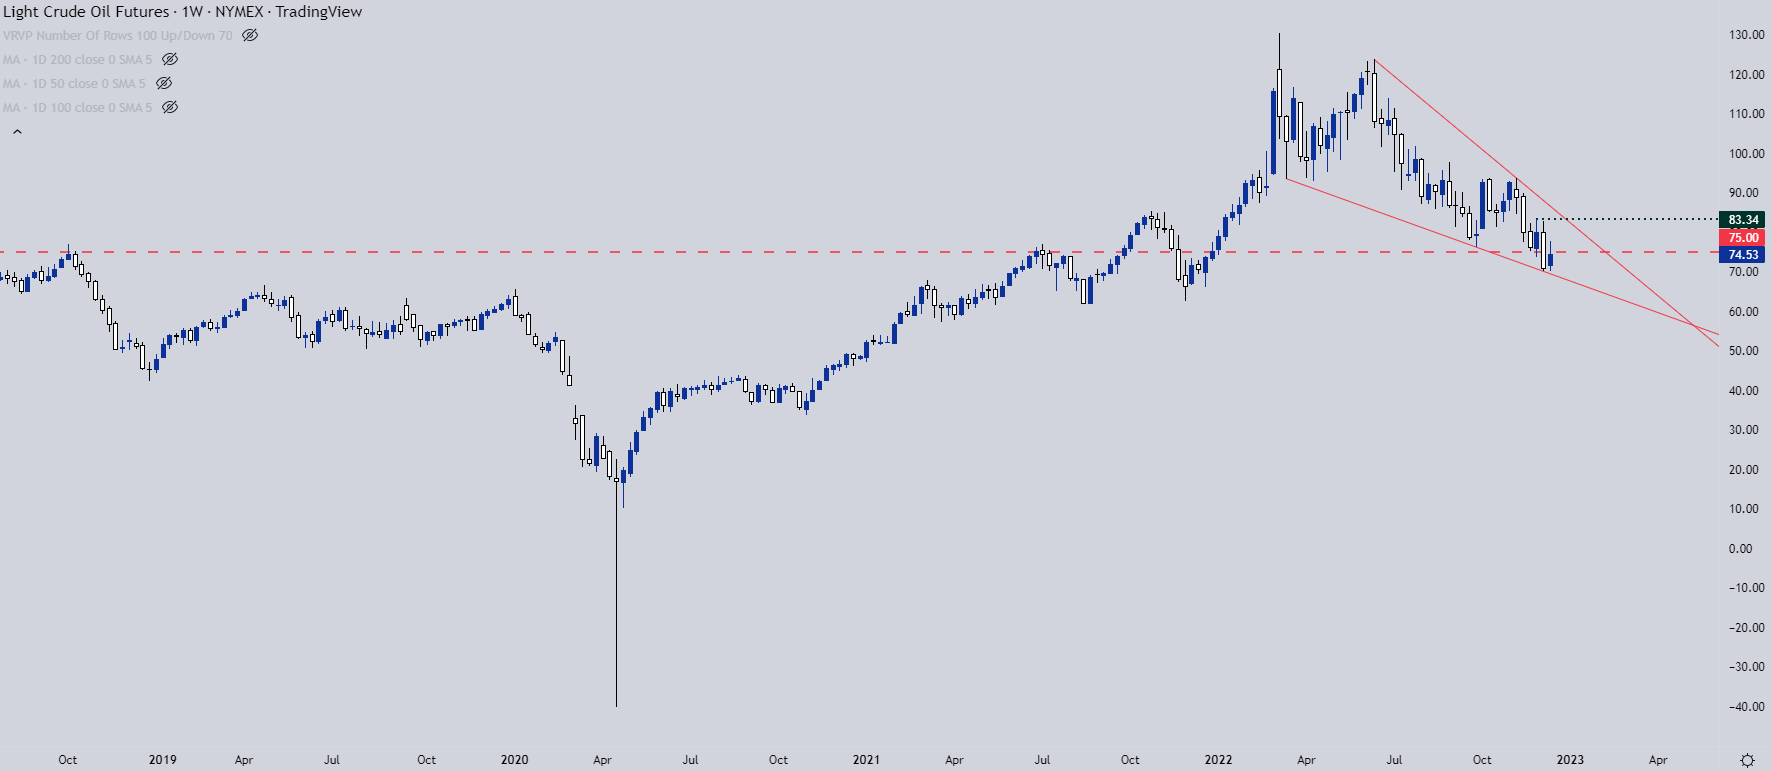
Source TradingView, chart prepared by James Stanley


