
OIL PRICE FORECAST:
- Oil prices rise to their best level in two weeks on supply disruption risks
- Despite recent gains, the technical outlook remains somewhat bearish for WTI crude
- This article looks at key tech levels to watch in the coming sessions

Most Read: Gold Could Find It Tough to Crack $2000
Oil prices (WTI futures) extended their recovery, advancing for a second consecutive session and climbing on Tuesday to their best level in two weeks, near $73.75. Gains were driven by energy flow disruptions after political disputes between Iraq, Iraq’s semi-autonomous Kurdish region and Turkey halted exports of some 450,000 barrels of crude per day.
If flows are not restored soon, global supplies could become constricted, bolstering oil’s upside in the near term despite rising headwinds for growth-linked commodities, including the increasing likelihood of a U.S. recession. For this reason, traders should keep a close eye on developments in the Middle East, at least until regional frictions begin to ease.
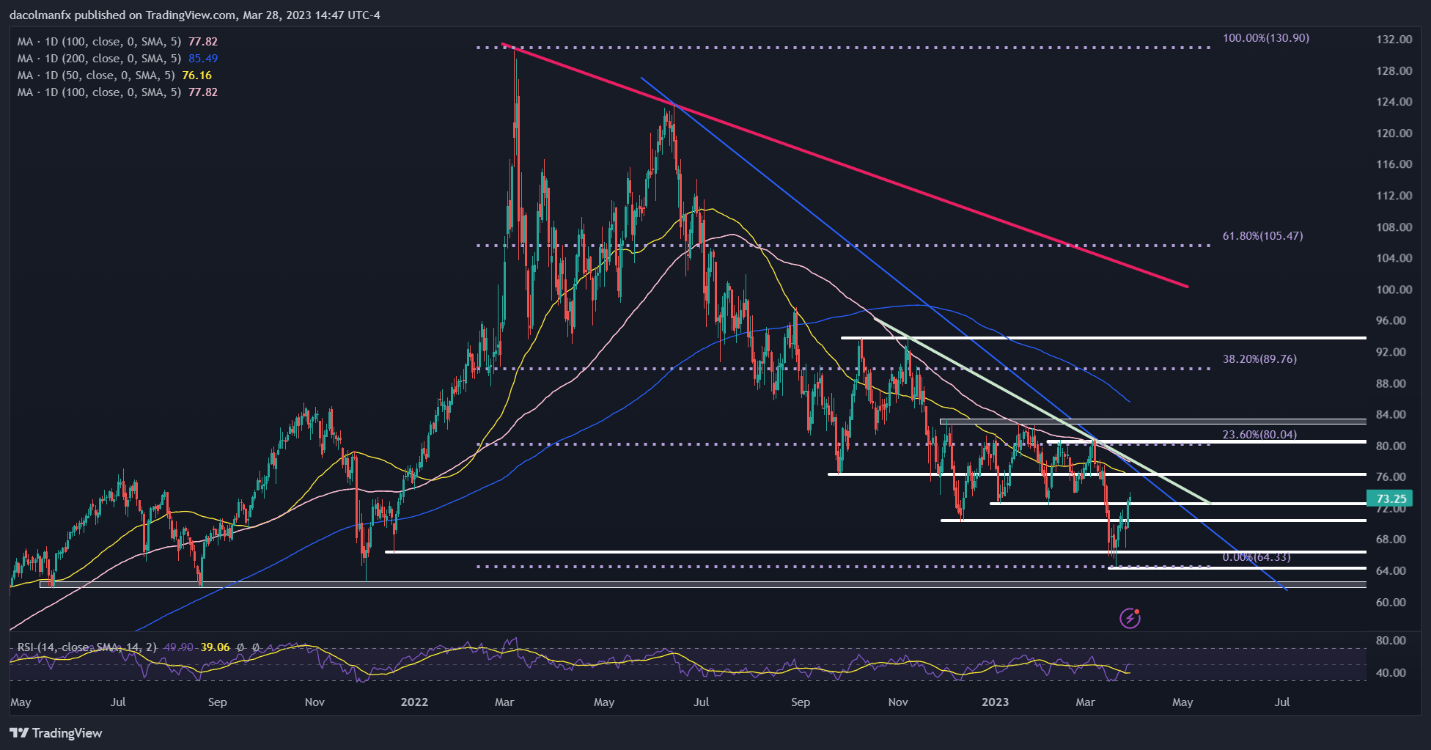
From a technical standpoint, the recent rebound is encouraging, but oil remains biased to the downside over a medium-term horizon following the sell-off from early March, with prices firmly below their 200-, 100- and 50-day moving average. That said, the path of least resistance may be lower heading into the second quarter of 2023.
In the event of a bearish reversal, initial support rests at $72.50, followed by the psychological $70.00 level. If this floor is taken out decisively, selling interest could accelerate in short order, paving the way for a retest of the 2023 lows located at $64.25. On further weakness, the focus shifts to the $62.00 area, the next pivotal support to keep in mind.
On the other hand, if bulls manage to retain control of the market and push oil a little higher, trendline resistance looms at $76.25, near the 50-day simple moving average. Prices are likely to face rejection from this region, but in a breakout scenario, buyers could gain strength to launch an attack on the $80.00 level, which corresponds to the 23.6% Fib retracement of the 2022/2023 sell-off.
| Change in | Longs | Shorts | OI |
| Daily | 3% | -7% | 1% |
| Weekly | 31% | -38% | 7% |
OIL PRICE TECHNICAL CHART