
NASDAQ 100 FORECAST:
- The Nasdaq 100 rebounds off technical support heading into the weekend following a selloff in the previous trading sessions
- Amazon leads the charge higher thanks to solid corporate earnings
- Despite the positive mood on Wall Street, market risks remain elevated ahead of the Fed decision next Wednesday
Trade Smarter - Sign up for the DailyFX Newsletter
Receive timely and compelling market commentary from the DailyFX team
Most Read: USD Breaking News - Dollar Index Slides as PCE Data Declines in Line with Estimates
The Nasdaq 100 staged a moderate comeback on Friday after a large selloff in previous trading sessions, with the tech index bouncing off cluster support in the 14,150/13,930 region, propelled higher by Amazon's spectacular rally in the aftermath of the company’s quarterly results.
For context, shares of the e-commerce giant (AMZN) advanced more than 7% following better-than-expected Q3 earnings and constructive guidance for its cloud services business, which accelerated late in the quarter, with "surprising" uptake for its generative AI products.
AMAZON EARNINGS
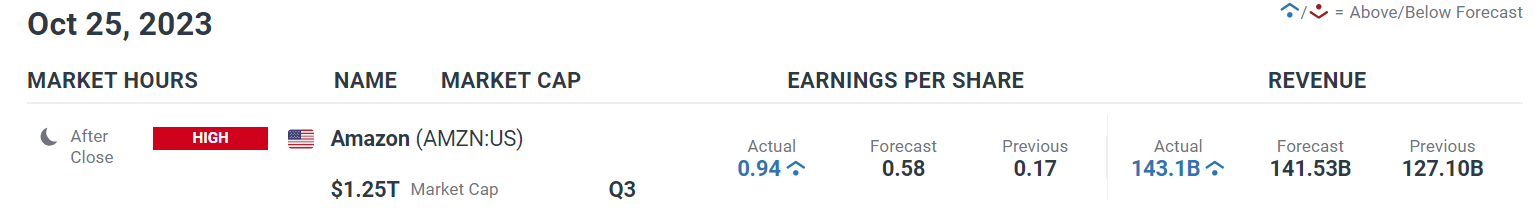
Source: DailyFX Earnings Calendar
For those looking for a more comprehensive view of U.S. equity indices, our Q4 stock market trading guide is the key to valuable insights. Grab your copy now!

While sentiment appears to be on the mend, a one-day relief rally will not significantly erase what has transpired since the middle of July: the tech index has fallen sharply, entering correction territory earlier this week after posting a 10% drop from the 2023 high.
For clues on market trajectory, traders should closely follow the Federal Reserve's monetary policy announcement next week and, more importantly, its forward guidance. While no change in interest rates is expected, the central bank could offer insight into its next steps in terms of its hiking campaign.
With Fedspeak mixed in recent weeks, it is important to watch what Fed Chair Powell has to say. In the event that the FOMC shows an inclination to hike borrowing costs again in 2023, tech stocks could come under pressure. Conversely, any signal that the tightening cycle has ended should favor risk assets.
The U.S. economy has been extremely resilient this year, thanks in part to strong consumer spending. Against this backdrop, inflation could remain sticky, pushing policymakers to keep their options open in case further monetary policy tightening is necessary. This could weigh on the Nasdaq 100.
If you've been discouraged by trading losses, consider taking a proactive approach to boost your skills. Download our guide, "Traits of Successful Traders," and uncover a valuable collection of insights to help you steer clear of common trading pitfalls.

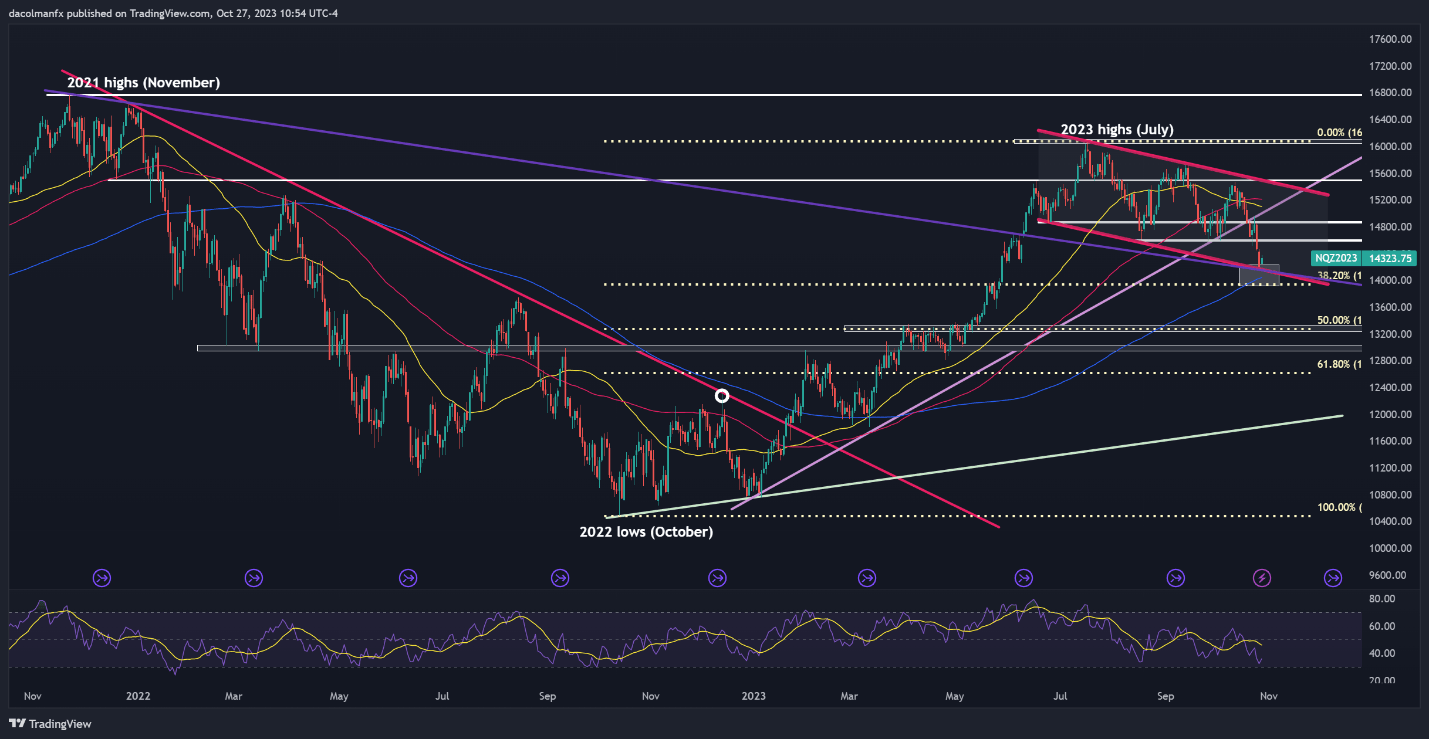
NASDAQ 100 TECHNICAL ANALYSIS
From a technical standpoint, the Nasdaq 100 is currently sitting near an area of cluster support that stretches from 14,150 to 13,930, where the lower limit of the short-term descending channel converges with the 200-day SMA and the 38.2% Fibonacci retracement of the October 2022/July 2023 leg higher.
To create a pathway for a potential bullish resurgence, it is vital for confluence support in the 14,150/13,930 range to hold. Any breach of this zone could spark a steep retrenchment, potentially taking prices towards 13,270, which aligns with the 50% Fib retracement.
In the event that the bulls manage to drive the index higher, initial resistance is positioned at 14,600. Upside clearance of this barrier could rekindle upward impetus and pave the way for a move to 14,860. On further strength, the attention will turn to 15,100.
Seeking actionable trading insights? Download our top trading opportunities guide packed with interesting technical and fundamental trading setups!

NASDAQ 100 TECHNICAL CHART