


US Equities Technical Forecast:
- Us equities were mixed last week, but Nasdaq 100 roared higher
- The S&P 500 also increased, but the Dow Jones disappointed
- Combined US equities technical outlook seems to be neutral

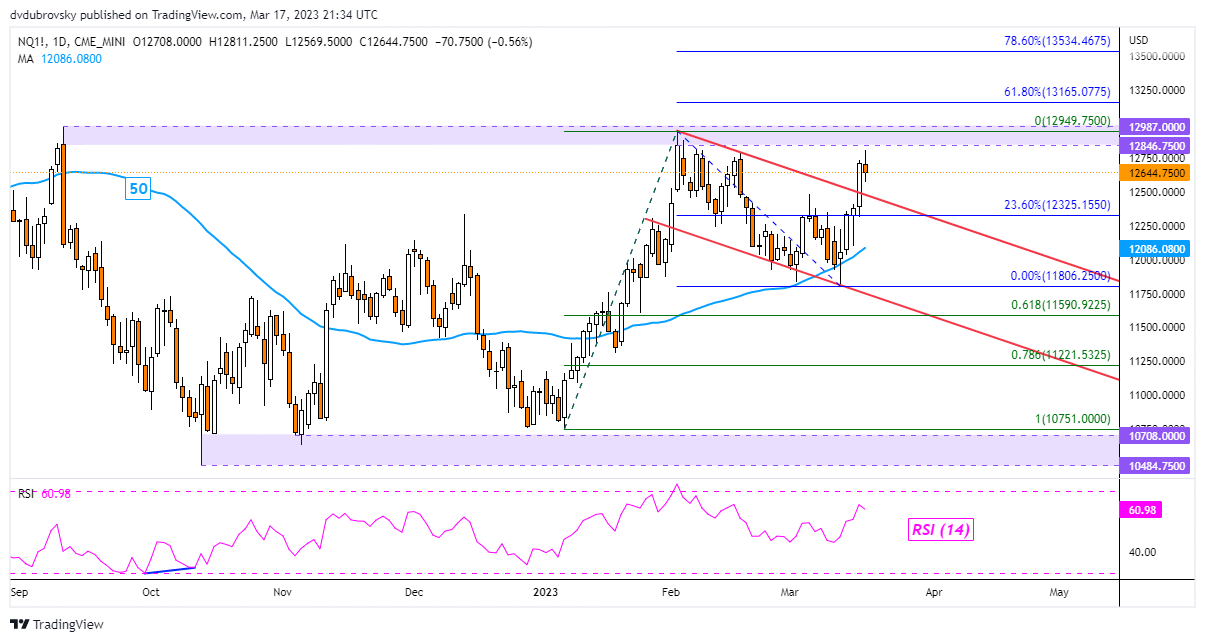
Nasdaq 100 Outlook - Neutral
The Nasdaq 100 rallied 5.65 percent last week in the best 5-day performance since November. From a technical standpoint, we saw the index push above a near-term falling channel, offering a neutral outlook for the week ahead. The reason why it is not yet bullish is that prices remain under the well-established 12846 – 12987 resistance zone. Confirming a breakout above this zone would offer an increasingly bullish outlook, exposing the 61.8% and 78.6% Fibonacci extension levels at 13165 and 13534, respectively. In the event of a turn lower, keep a close eye on the 50-day Simple Moving Average (SMA).
Trade Smarter - Sign up for the DailyFX Newsletter
Receive timely and compelling market commentary from the DailyFX team
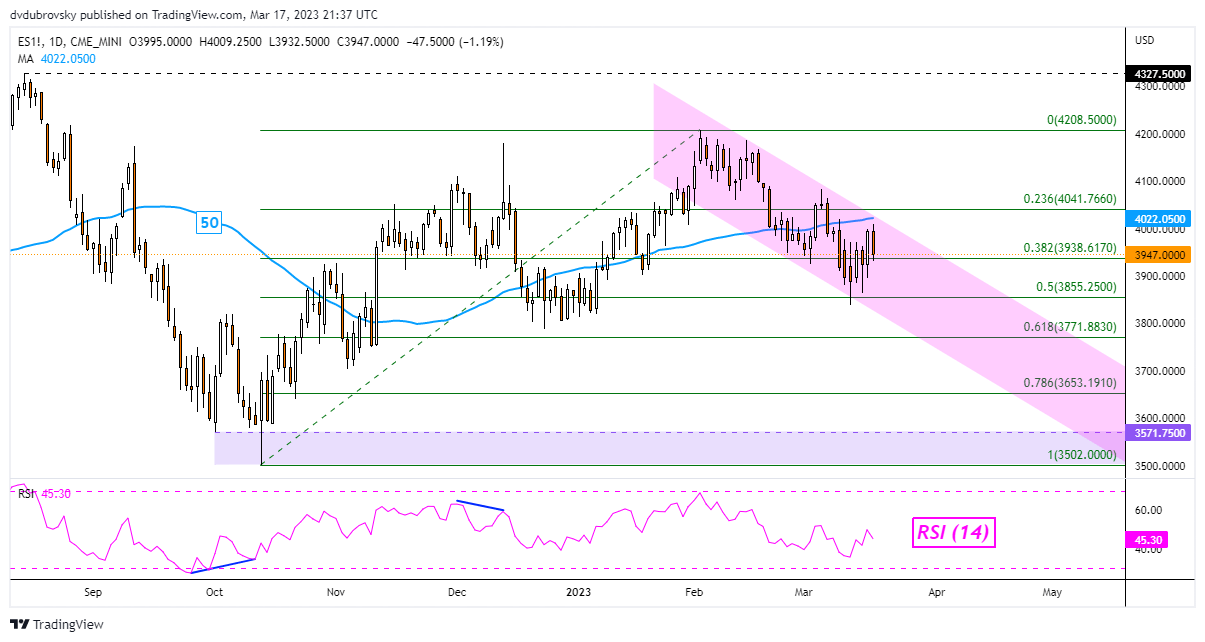
S&P 500 Outlook - Bearish
The S&P 500 gained 1.27% last week. Compared to the Nasdaq 100, upside progress was relatively tame. From a technical standpoint, the outlook remains bearish. That is because prices remain within the boundaries of a falling channel. Also, the 50-day SMA held as key resistance last week. Pushing above resistance would offer an increasingly neutral outlook, placing the focus on the February high at 4208. Otherwise, extending losses places the focus on the floor of the channel.
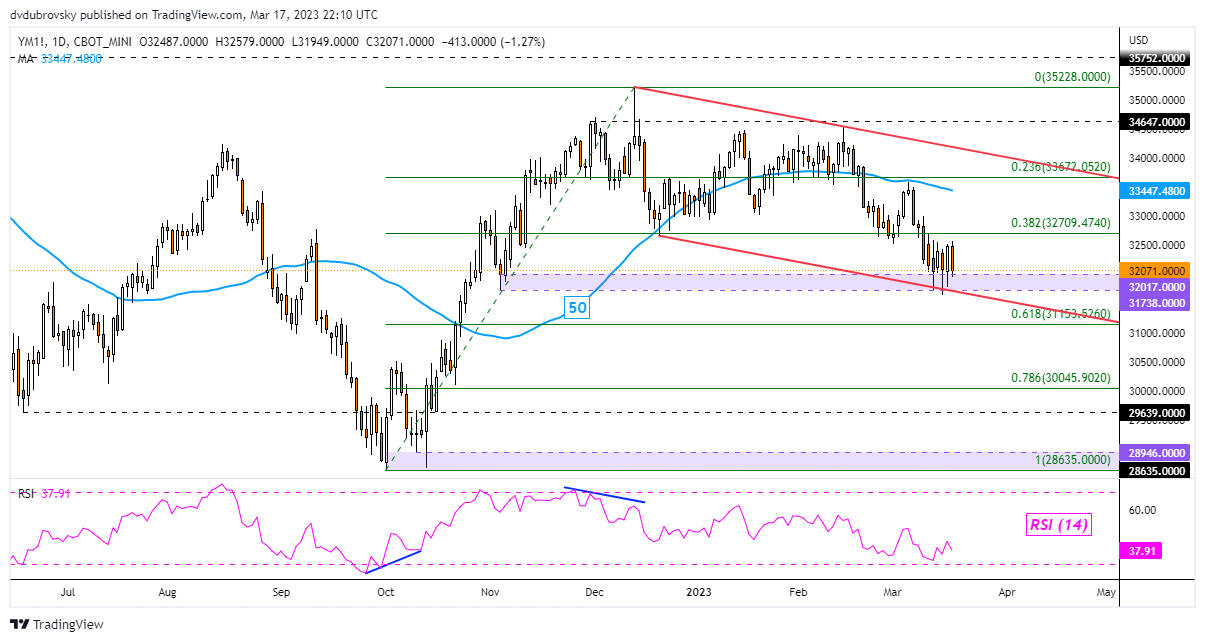
Dow Jones Outlook - Neutral
The Dow Jones was mostly little changed last week, with the Nasdaq/Dow ratio soaring the most since 2008. While the Dow remains within the boundaries of a falling channel, prices were unable to clear the key 31738 – 32017 support zone, reinforcing this range as key support. Extending lower would open the door to a bearish outlook. Otherwise, we may see a bounce toward the ceiling of the channel, which would be a more neutral view. Prices may have to clear the ceiling to offer meaningful upside potential. Below, keep an eye on the 61.8% Fibonacci retracement level at 31153.
--- Written by Daniel Dubrovsky, Senior Strategist for DailyFX.com
To contact Daniel, follow him on Twitter:@ddubrovskyFX


