
US Dollar Vs Euro, British Pound, Australian Dollar – Price Setups:
- EUR/USD is testing key support, while GBP/USD has fallen under a vital floor.
- AUD/USD is back at the lower end of the recent range; USD/JPY eyes psychological 150..
- What’s next for EUR/USD, GBP/USD, AUD/USD, and USD/JPY?

The US dollar has broken key resistance levels against some of its peers as higher-for-longer rates view solidifies after the US Federal Reserve last week signaled one more rate hike before the end of the year and fewer rate cuts than previously indicated. For a more detailed discussion, see “US Dollar Gets a Boost from Optimistic Fed; EUR/USD, GBP/USD, AUD/USD,” published September 21.
EUR/USD Weekly Chart
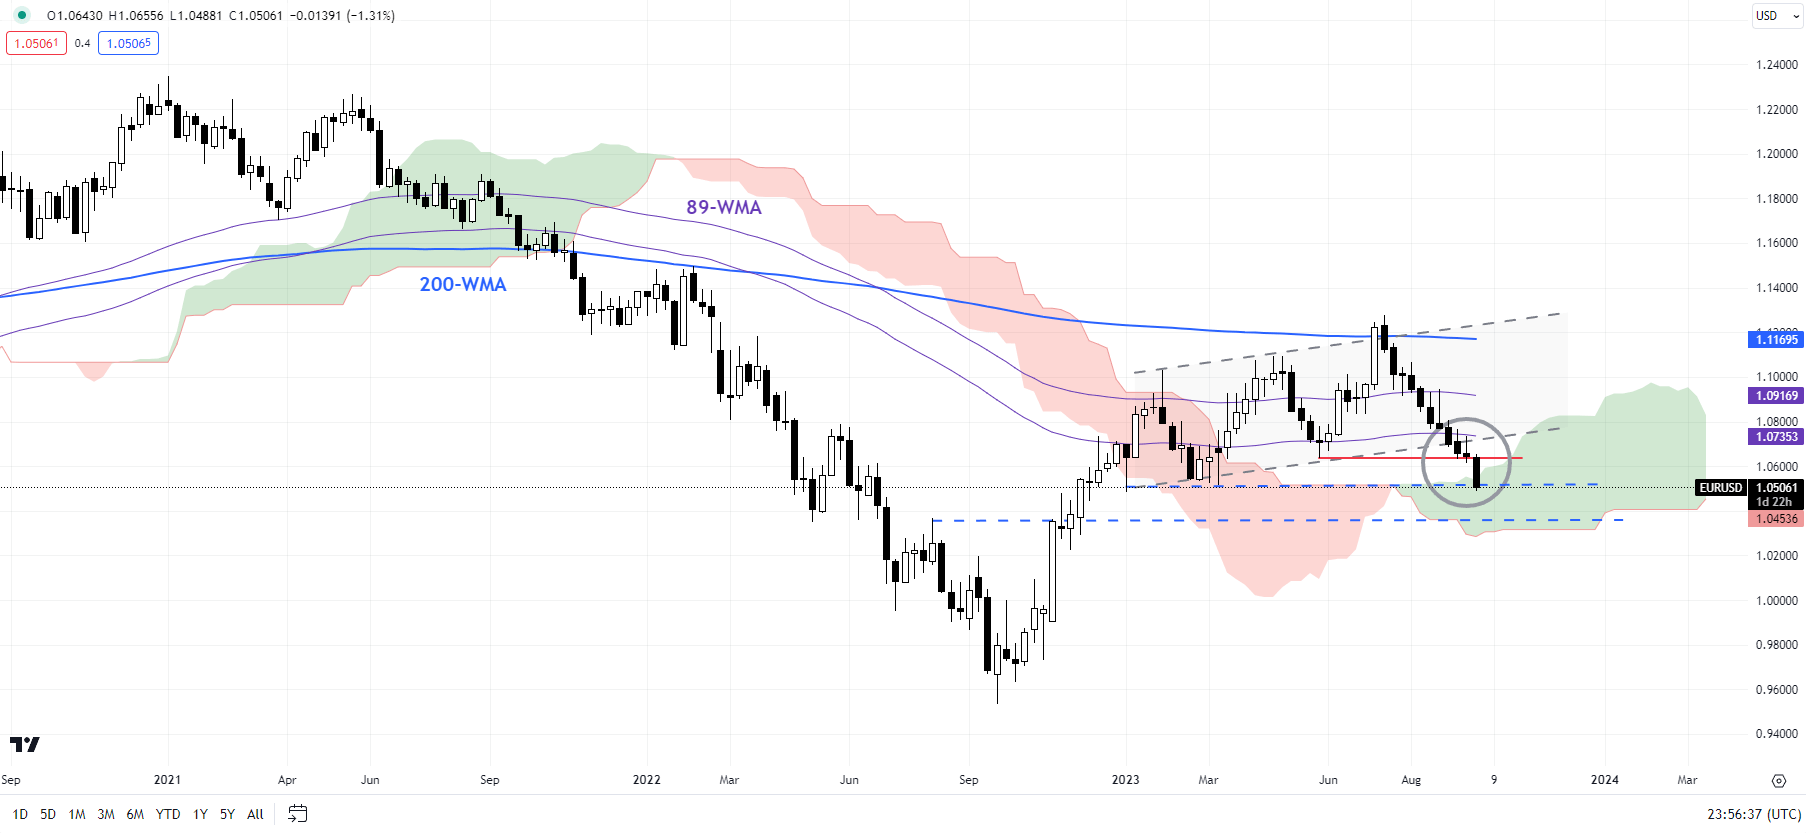
Chart Created by Manish Jaradi Using TradingView
EUR/USD: Tests major support
EUR/USD’s break last week below the upper edge of a rising channel from early 2023, coinciding with the May low of 1.0630, confirms the medium-term upward pressure has faded. The pair is now testing the January low of 1.0480 – a break below would pose a serious threat to the medium-term uptrend that started late last year. Subsequent support is on the lower edge of the Ichimoku cloud on the weekly chart (now at about 1.0300). On the upside, EUR/USD needs to break above the September 20 high of 1.0735 at minimum for the immediate downside risks to dissipate.For a discussion on fundamentals, see “Euro Could Be Due for a Minor Bounce: EUR/USD, EUR/JPY, EUR/GBP, Price Setups,” published September 19.
GBP/USD Weekly Chart
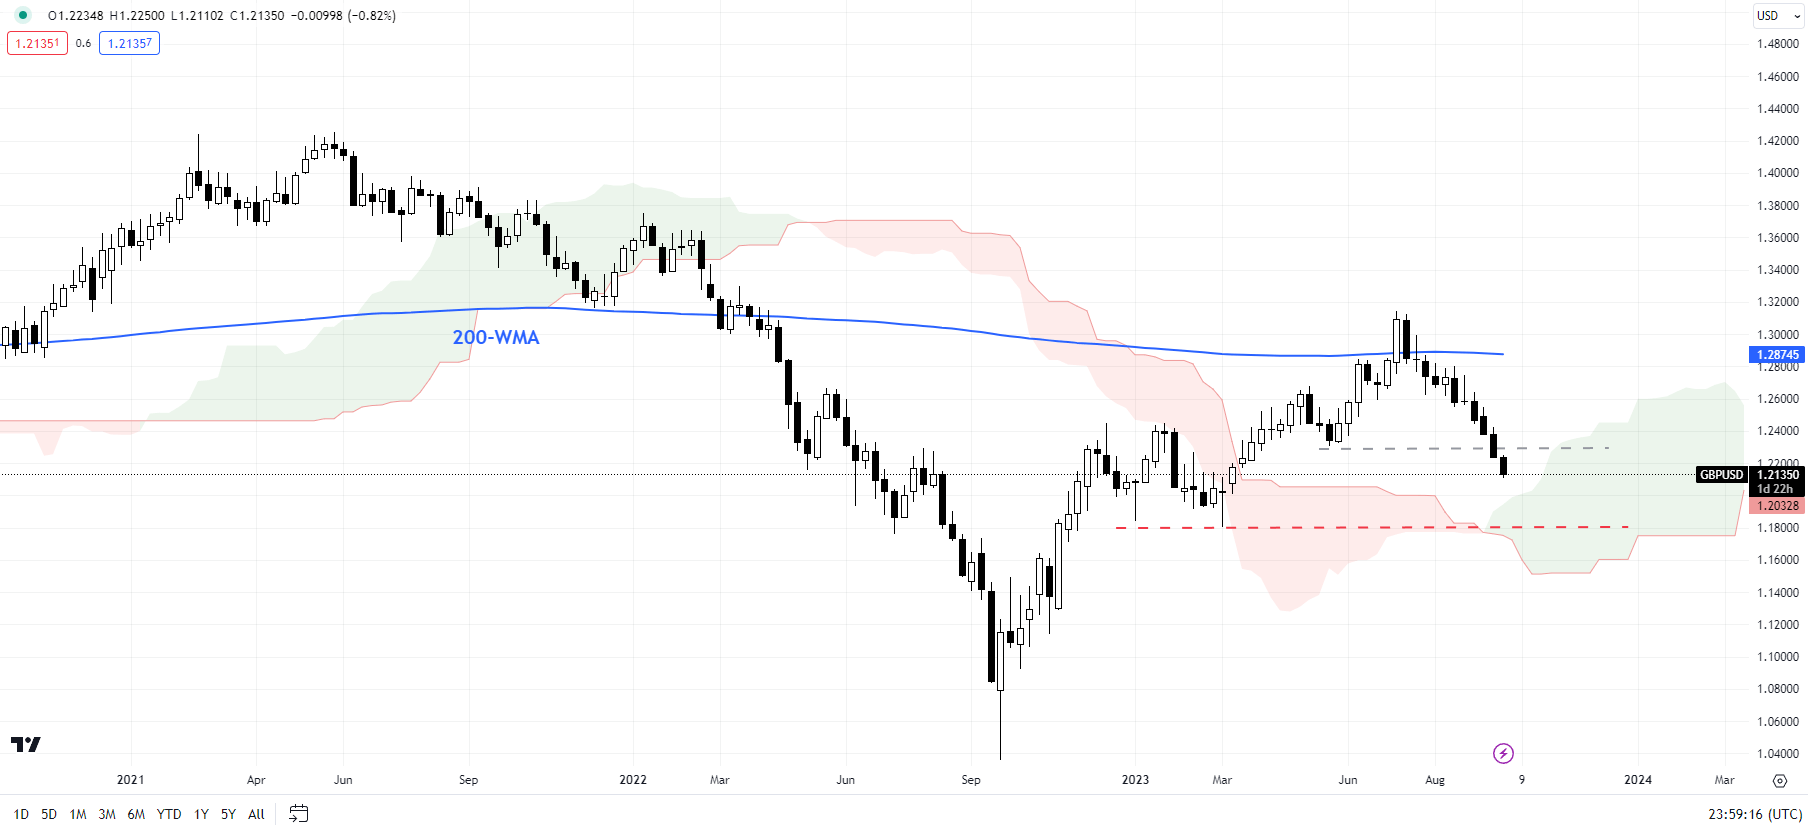
Chart Created by Manish Jaradi Using TradingView

GBPUSD: Bearish bias intact
GBP/USD has fallen under a vital floor at the May low of 1.2300, temporarily disrupting the higher-low-higher-high sequence since late 2022. The retreat in July from the 200-week moving average and the subsequent sharp decline raises the odds that the retracement is the correction of the rally that started a year ago. For more discussion, see “Pound’s Resilience Masks Broader Fatigue: GBP/USD, EUR/GBP, GBP/JPY Setups,” published August 23. The next significant support is at the March low of 1.1800. A fall below 1.1600-1.1800 would pose a risk to the broader recovery that started in 2022.
AUD/USD Weekly Chart
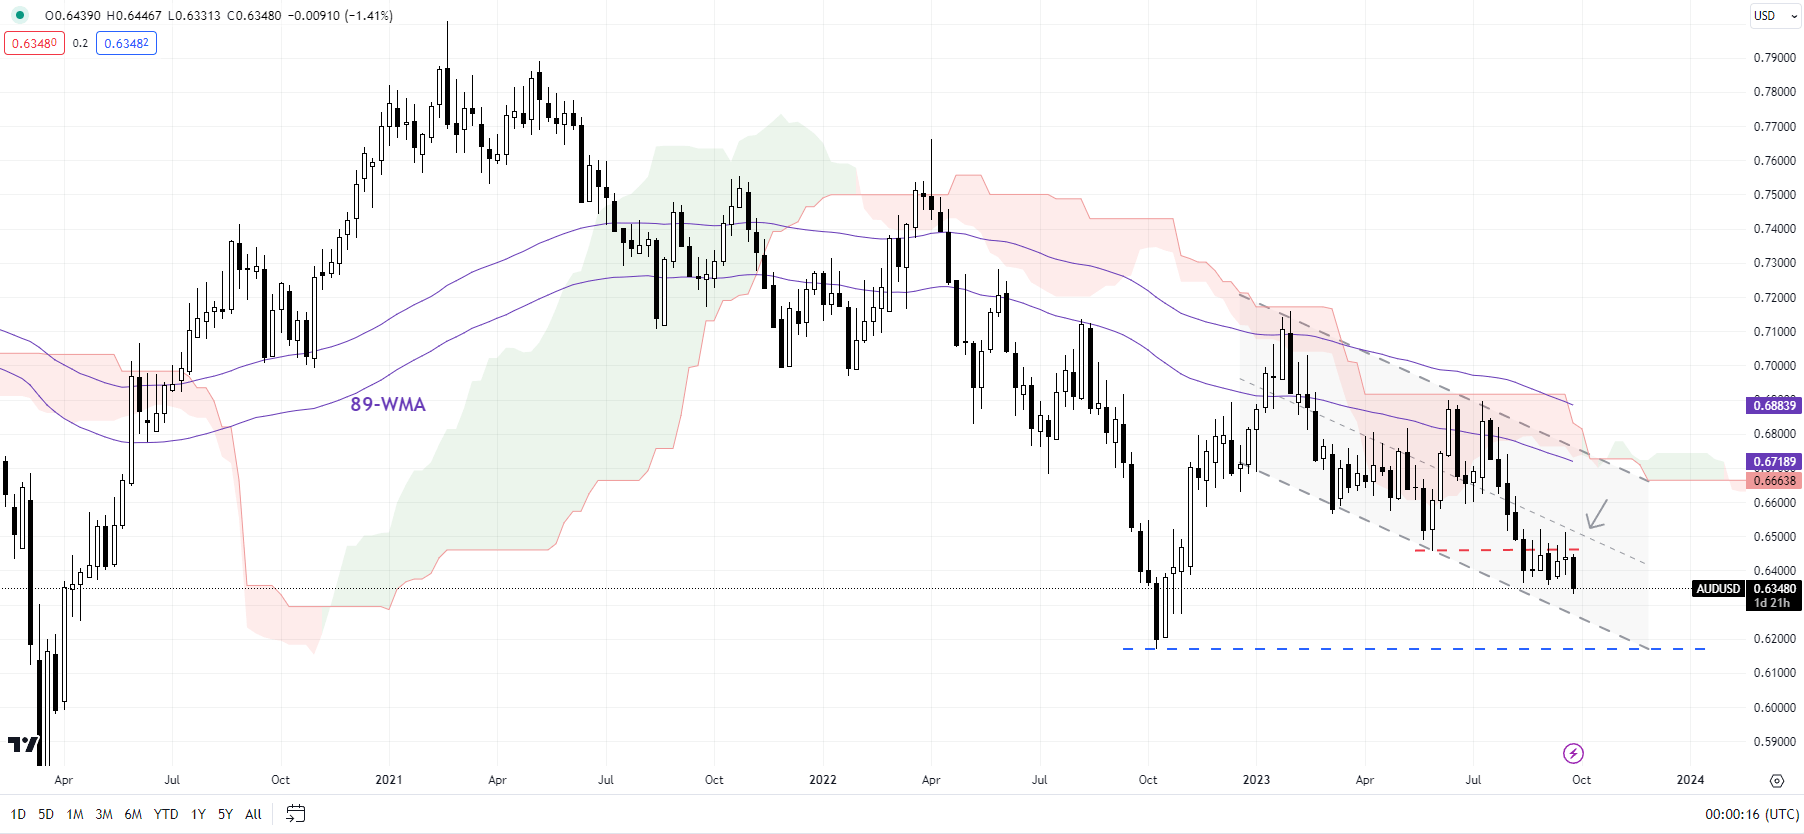
Chart Created by Manish Jaradi Using TradingView
AUD/USD: Retests the lower end of the recent range
AUD/USD is attempting to break below the lower end of the recent range at 0.6350. This follows a retreat from fairly strong converged resistance at the August high of 0.6525, coinciding with the upper edge of a rising channel since early September. Any break below 0.6350 could expose downside risks toward the November 2022 low of 0.6270. Below that the next support is at the October low of 0.6170.
USD/JPY Weekly Chart
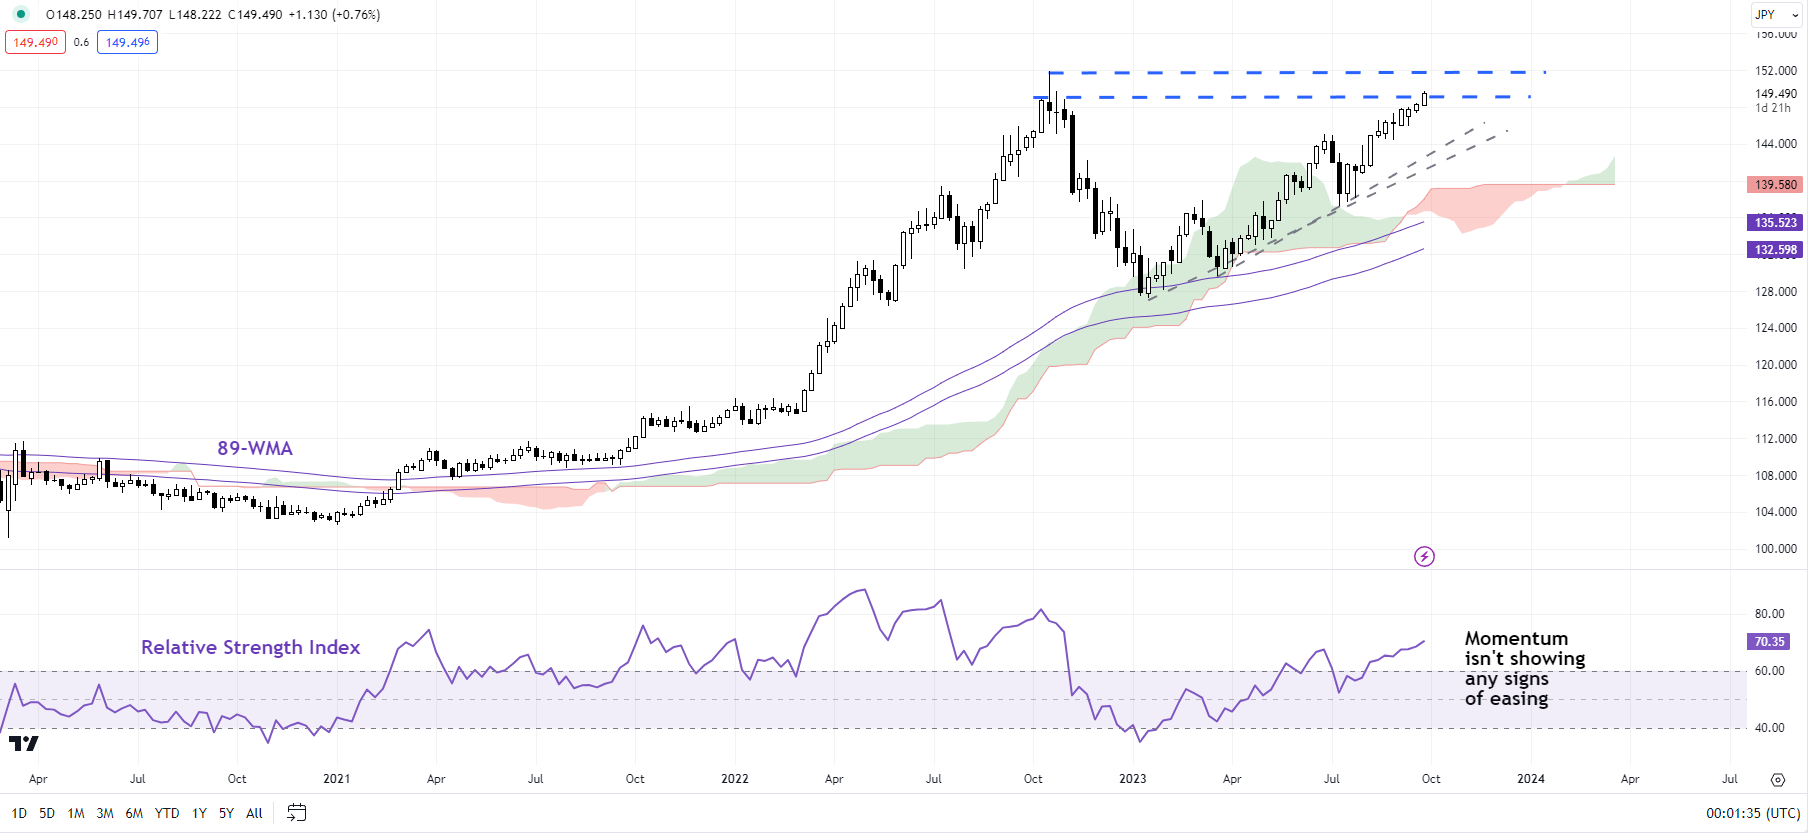
Chart Created by Manish Jaradi Using TradingView
USD/JPY: Psychological barrier at 150
USD/JPY is approaching the psychological barrier at 150, not too far from the 2022 high of 152.00. There is no sign of reversal of the uptrend, while momentum on the weekly charts isn’t showing any signs of fatigue. This suggests the pair could give a shot at 152.00. For the immediate upward pressure to begin easing, USD/JPY would need to fall below the early-September high of 147.75. Above 152.00, the next level to watch would be the 1990 high of 160.35. For more discussion, see “Japanese Yen After BOJ: What Has Changed in USD/JPY, EUR/JPY, AUD/JPY?” published September 25.

--- Written by Manish Jaradi, Strategist for DailyFX.com
--- Contact and follow Jaradi on Twitter: @JaradiManish