Gold Price Analysis and Chart
- Gold rally continues, fresh highs underpinned by geopolitical fears.
- US CPI may stall the precious metal’s rally in the short-term.
Download our Free Technical and Fundamental Q2 Gold Analysis below:

Most Read: Understanding Inflation and its Global Impact
The volatile situation in the Middle East remains unchanged as fears that the war of words between Israel and Iran escalates further. According to a range of news outlets, Iran’s Supreme Leader Ayatollah Ali Khamenei has vowed a strong response against Israel over the recent deaths of Iranian guard members in Syria. Israeli Foreign Minister Israel Katz responded on X (formerly Twitter) that ‘if Iran attacks Israel from its territory, we will attack Iran.’ With a further escalation seemingly likely, investors are looking at haven assets to hedge against future risks.
While gold is currently benefitting from the geopolitical risk-off bid, US data will likely become the new, short-term, driver of price action. At 13:30 UK today the latest US inflation data hits the screens, followed later in the session by the minutes of the last FOMC meeting. US inflation remains uncomfortably high for the Federal Reserve with several members recently paring back interest rate cut expectations. According to market pricing, the probability of a rate cut at the June 12th FOMC meeting is now seen at a fraction over 50%, down from 61% one week ago. Headline US inflation is seen increasing to 3.4% from 3.2% on an annual basis and falling to 0.3% from 0.4% on a month-on-month basis. Any move higher in either headline or core readings will see rate cut expectations pared back further, and this will weigh on gold at its current elevated levels.

While a short-term move lower is likely to occur on any higher-than-expected US inflation readings, the precious metal will remain supported by the current geopolitical backdrop. Initial support is likely around the $2,280/oz. level
Gold Daily Price Chart – April 10th, 2024
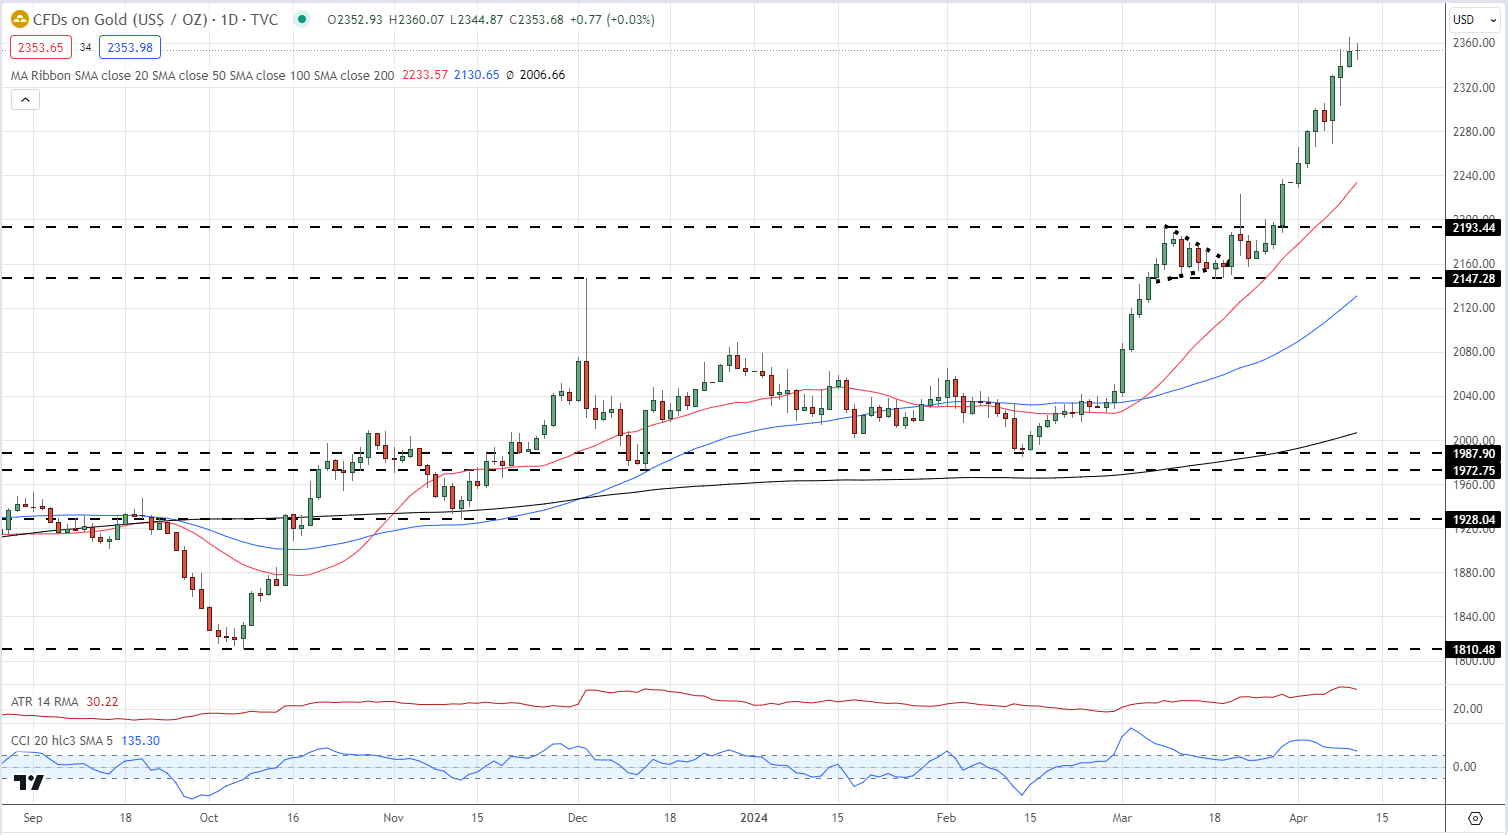
Chart via TradingView
Retail trader data shows 46.69% of traders are net-long with the ratio of traders short to long at 1.14 to 1.The number of traders net-long is 4.88% higher than yesterday and 13.88% higher from last week, while the number of traders net-short is 0.13% higher than yesterday and 0.76% higher from last week.
We typically take a contrarian view to crowd sentiment, and the fact traders are net-short suggests Gold prices may continue to rise.
| Change in | Longs | Shorts | OI |
| Daily | 0% | 5% | 2% |
| Weekly | -7% | 3% | -3% |
What is your view on Gold – bullish or bearish?? You can let us know via the form at the end of this piece or contact the author via Twitter @nickcawley1.