


Gold Price (XAU/USD), Chart, and Analysis
• Gold eyes $1,615/oz. as US Treasury yields nudge higher.
• Lower highs and lower highs are prominent on the daily gold chart.

The recent sell-off in the US dollar is reversing with the dollar index (DXY) turning higher for the second consecutive day. The greenback is being propped up by higher US Treasury yields with the 2-year UST offered at 4.484%, while the 10-year trades at 4.065%. US Treasury yields are getting a lift from comments from Fed board member Neel Kashkari who yesterday pointed out that unless progress was made in the fight against inflation, interest rate rises may not ‘stop at 4.5%, or 4.75% or something like that’. Higher US interest rates and Treasury yields remain a strong headwind for gold.
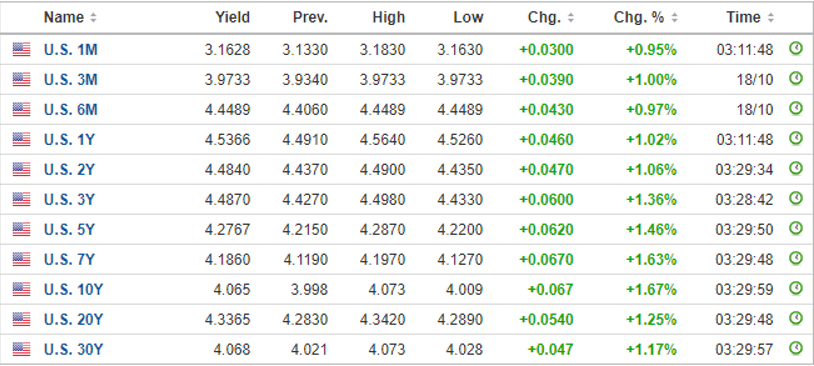
Yields via Investing.Com
For all market-moving data releases and events, see the DailyFX Economic Calendar.
Trade Smarter - Sign up for the DailyFX Newsletter
Receive timely and compelling market commentary from the DailyFX team
The daily Gold chart shows an unbroken series of lower highs and lower lows dictating current price action. Other notable technical setups on the chart show a bearish ‘death cross’ made at the start of June, while the precious metal now trades below all three simple moving averages.
The path of least resistance for gold looks lower with support at $1,615/oz. the first landing point. Below here, round number support at $1,600/oz. guards a small swing low at $1,567/oz. made back in April 2020. A cluster of recent highs all the way back to $1,688/oz. will slow any bullish momentum.
Gold Daily Price Chart – October 19, 2022
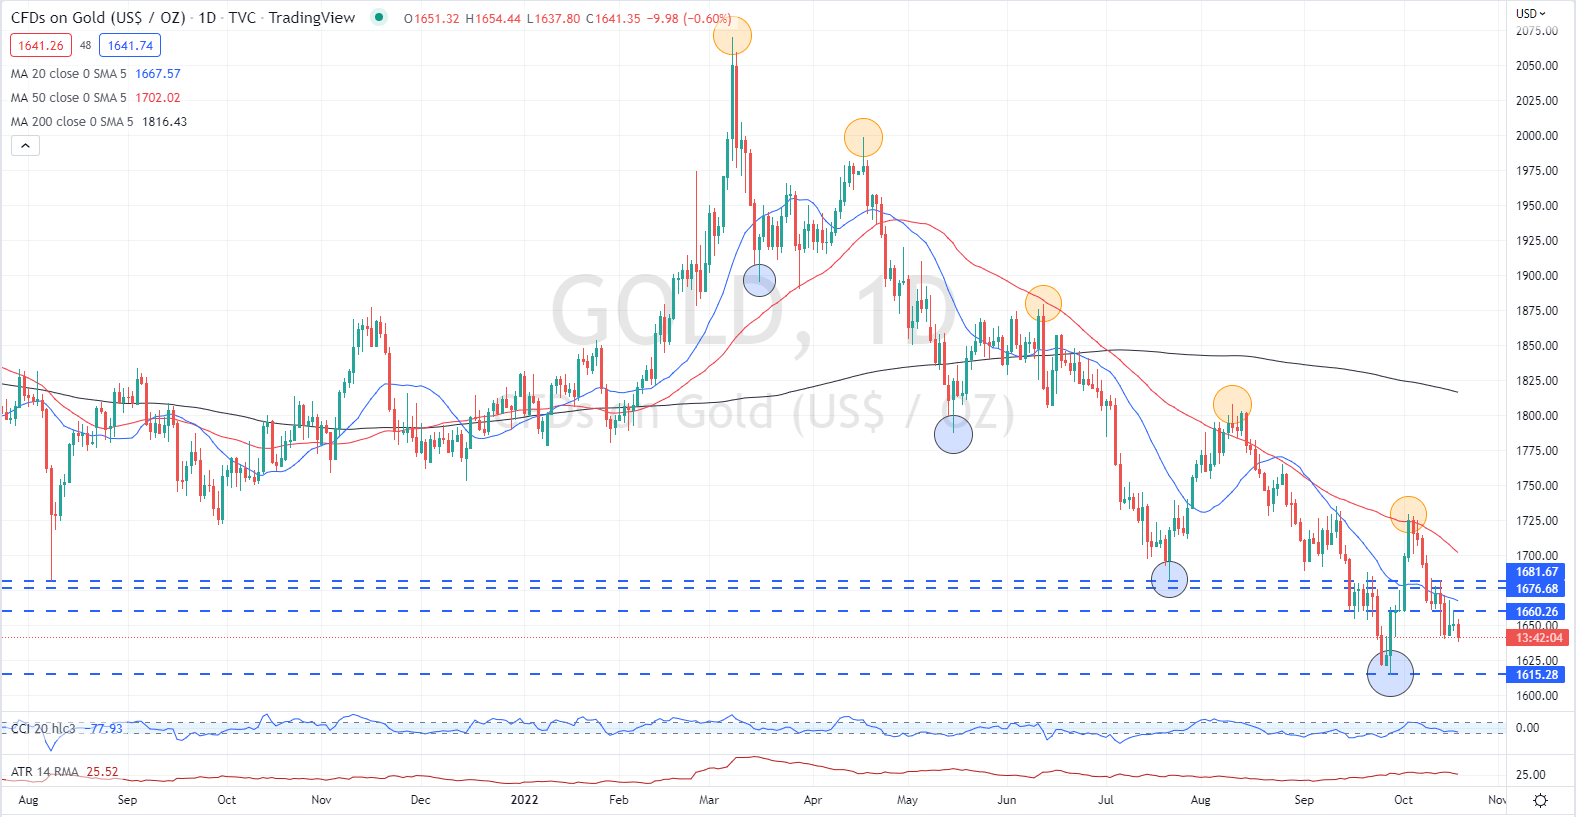
Chart via TradingView
Retail trader data show that 82.38% of traders are net-long with the ratio of traders long to short at 4.68 to 1. The number of traders net-long is 3.07% higher than yesterday and 11.04% higher from last week, while the number of traders net-short is 1.08% higher than yesterday and 9.27% lower from last week.
We typically take a contrarian view to crowd sentiment, and the fact traders are net-long suggests Gold prices may continue to fall. Traders are further net-long than yesterday and last week, and the combination of current sentiment and recent changes gives us a stronger Gold-bearish contrarian trading bias.
What is your view on Gold – bullish or bearish?? You can let us know via the form at the end of this piece or you can contact the author via Twitter @nickcawley1.


