


Gold Price (XAU/USD), Chart, and Analysis
- Multi-month resistance holds firm for now.
- The technical setup remains positive for the precious metal.

The ongoing US dollar sell-off, and fall in US Treasury yields, continues to boost the value of gold with the precious metal breaking above $1,800/oz. for the first time since early July. While the move higher was subsequently rejected, gold looks set to re-test this multi-month high and push even further ahead.
For all market-moving data releases and events, see the DailyFX Economic Calendar.
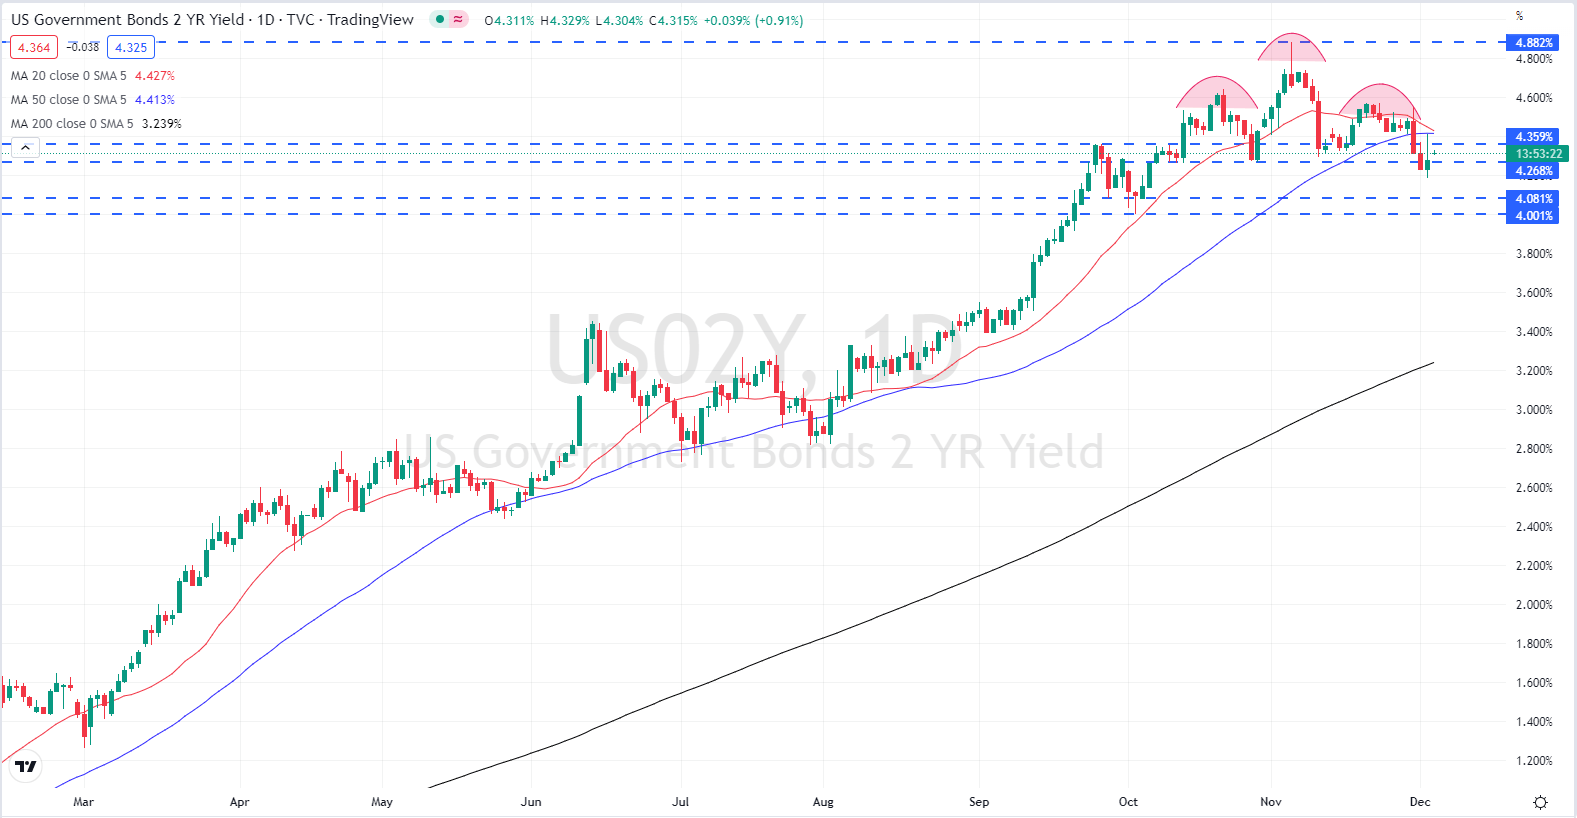
The short-term decline in the US dollar continues with the greenback giving back a chunk of this year’s gains against a host of other currencies. This USD sell-off has helped push the price of gold higher over the last few weeks. The recent shift in the Fed’s stance from repeated over-sized rate hikes to a more considered pace has seen short-term US Treasury yields, and the greenback, fall sharply, and further falls look likely. The interest-rate sensitive UST 2-year has made a classic head and shoulders pattern and with the neckline of the formation now under threat, a re-test of the 4% level is seen.

US Treasury 2-Year Yield Chart – December 5, 2022
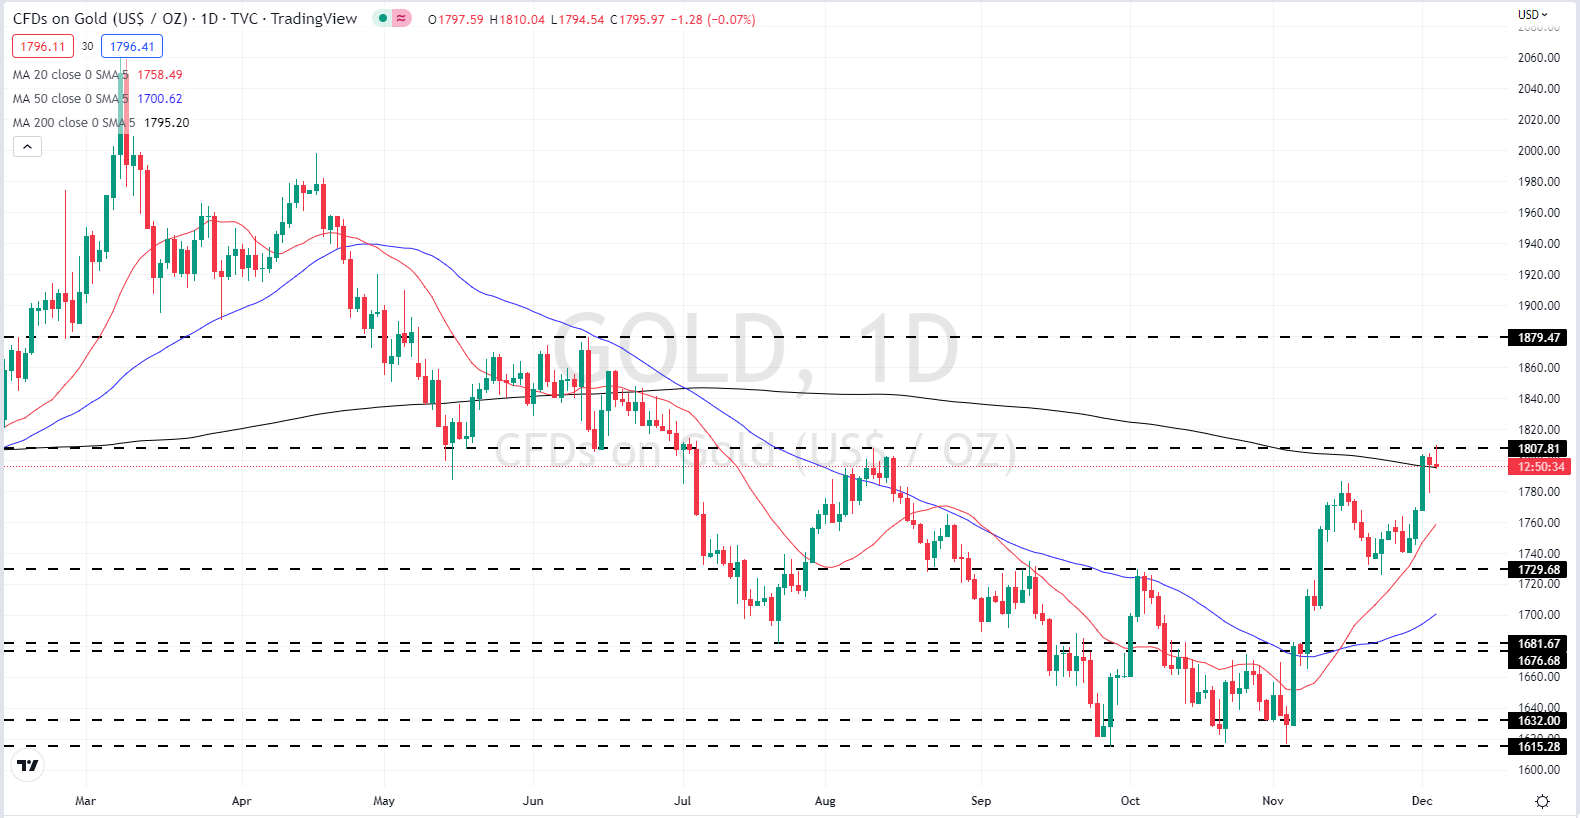
With the US dollar coming under increasing pressure, the outlook for gold looks positive although a period of short-term consolidation looks set to play out. For the precious metal to forge further ahead it needs to cement its position above the 200-day moving average that currently sits at $1,795/oz. A break above this technical indicator, and resistance at $1,807/oz. would leave the June 13 lower high at $1,879/0z. the next objective. A period of consolidation around current levels may be seen before the next move higher.
Gold Daily Price Chart – December 5, 2022
All Charts via TradingView
| Change in | Longs | Shorts | OI |
| Daily | 1% | -3% | -1% |
| Weekly | 2% | -8% | -2% |
Retail Traders Increase Their Net-Shorts
Retail trader data show 71.10% of traders are net-long with the ratio of traders long to short at 2.46 to 1.The number of traders net-long is 4.04% higher than yesterday and 12.88% lower from last week, while the number of traders net-short is 5.61% higher than yesterday and 4.17% higher from last week.
We typically take a contrarian view to crowd sentiment, and the fact traders are net-long suggests Gold prices may continue to fall. Yet traders are less net-long than yesterday and compared with last week. Recent changes in sentiment warn that the current Gold price trend may soon reverse higher despite the fact traders remain net-long.
What is your view on Gold – bullish or bearish?? You can let us know via the form at the end of this piece or you can contact the author via Twitter @nickcawley1.


