


Gold Price (XAU/USD), Chart, and Analysis
- Multi-month resistance remains in place.
- Short of higher highs/higher lows has stalled for now.

The US dollar and US Treasury yields are little changed as we start the week with both sitting in the middle of their respective ranges, waiting for the latest US inflation report (Tuesday 13:30 GMT) and Fed policy decision (Wednesday 19:00 GMT). Market forecasts are for inflation to have eased in November with the core y/y seen dropping to 6.1% from 6.3%, while the annual headline figure is seen slipping to 7.3% from 7.7% in October. The Federal Reserve is expected to lift interest rates by 50 basis points on Wednesday, after four consecutive 75bps hikes, but as always the post-FOMC press conference will be key in determining chair Powell’s thoughts on the economy. These two high-impact events will shape risk appetite going into the Christmas period.
For all market-moving data releases and events, see the DailyFX Economic Calendar.

The price of gold has been influenced to a large extent by US Treasury yields recently and this looks set to continue. Longer-dated bond yields have been edging lower, while the short-end of the Treasury curve remains elevated. The US 2s/10s curve is inverted by around 80 basis points currently, a strong signal that the US is entering, or is already in, a recession. If longer-dated US bond yields fall further, this should allow gold to move higher.
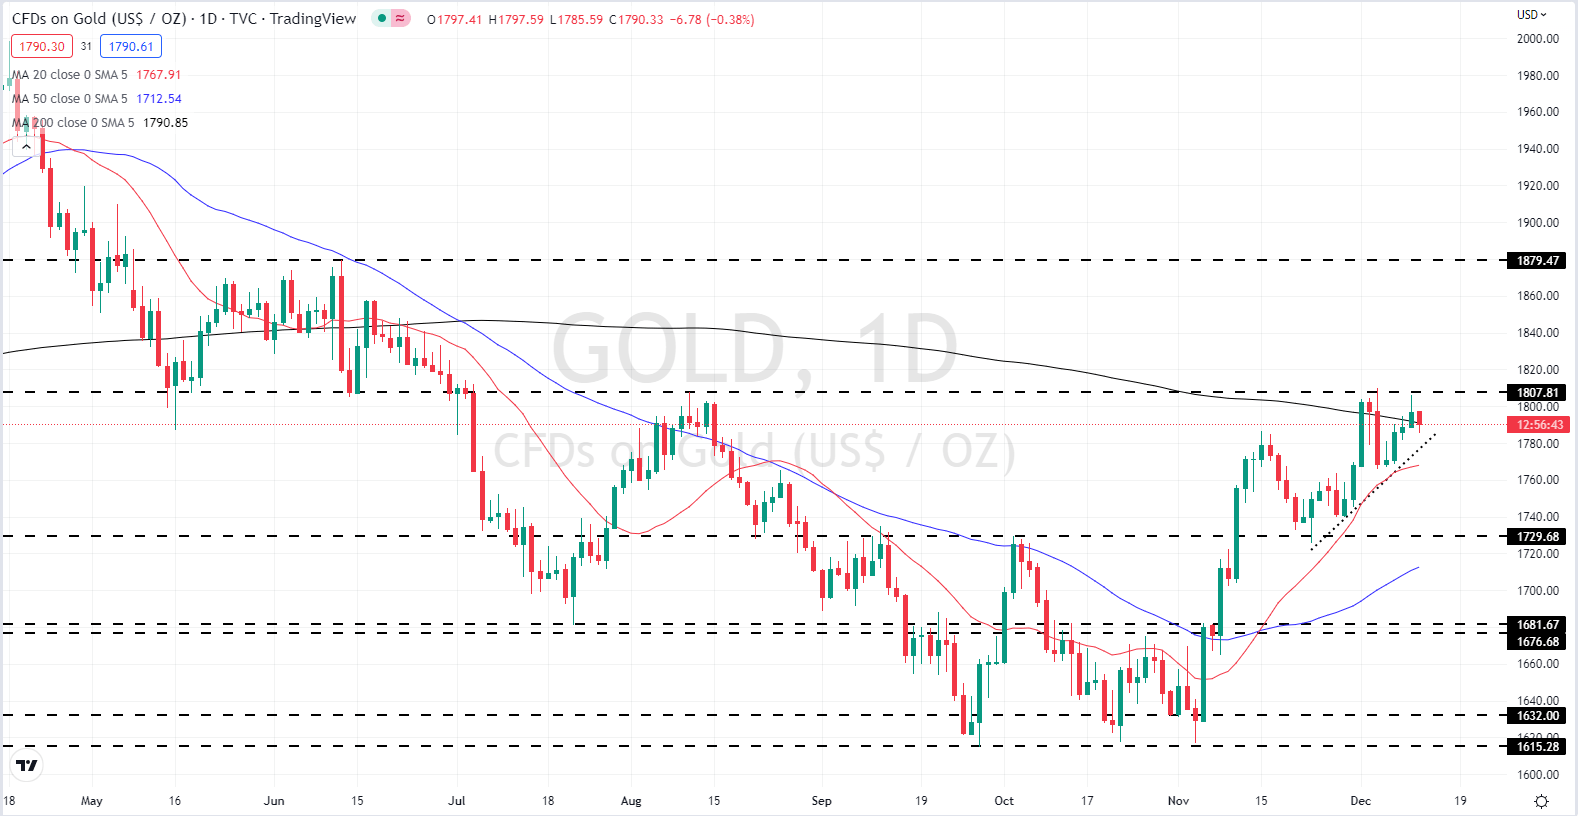
The daily chart shows gold testing and rejecting horizontal resistance around $1,807/oz. The short-term outlook is positive with a series of higher lows and higher highs on show, although a confirmed break above last Monday’s $1,810/oz. high will need to be made to keep this pattern in place. A group of recent lows around $1,766/oz. to $1,769/oz. should serve as short-term support ahead of the events in the US.
Forex Trading Patterns – What Happens Next?
Gold Daily Price Chart – December 12, 2022
| Change in | Longs | Shorts | OI |
| Daily | 1% | -3% | -1% |
| Weekly | 2% | -8% | -2% |
All Charts via TradingView
Retail Trade Positions Unchanged
Retail trader data show 72.06% of traders are net-long with the ratio of traders long to short at 2.58 to 1.The number of traders net-long is 1.46% higher than yesterday and 2.19% higher from last week, while the number of traders net-short is 3.94% higher than yesterday and 2.54% lower from last week.
We typically take a contrarian view to crowd sentiment, and the fact traders are net-long suggests Gold prices may continue to fall. Positioning is less net-long than yesterday but more net-long from last week. The combination of current sentiment and recent changes gives us a further mixed Gold trading bias.
What is your view on Gold – bullish or bearish?? You can let us know via the form at the end of this piece or you can contact the author via Twitter @nickcawley1.


