


GOLD PRICE OUTLOOK:
- Gold prices fall undermined by a strong U.S. dollar and rising nominal and real interest rates
- The FOMC decision will steal the limelight on Wednesday, with the event possibly catalyzing the next leg lower in precious metals
- This article looks at the key technical levels for XAU/USD to watch over the coming days
Trade Smarter - Sign up for the DailyFX Newsletter
Receive timely and compelling market commentary from the DailyFX team
Most Read: Silver Price Forecast: Clinging to Downtrend Ahead of FOMC - Levels for XAG/USD
Gold prices (XAU/USD) declined on Tuesday, down about 0.7% to $1,663 at the time of writing, pressured by a surge in U.S. Treasury rates and the U.S. dollar ahead of a high-impact event on Wednesday: the September FOMC announcement. In the morning trade, the 10-year benchmark nominal yield spiked 10 basis points to 3.59%, its highest level since February 2011, bolstering the DXY index above the psychological 110.00 handle, just touch below the multi-decade high set earlier this month.
Looking ahead, the outlook for bullion remains bleak, despite the ~7.7% cumulative decline that has already occurred over the past six weeks. Current developments in foreign exchange and fixed income markets should continue to undermine precious metals, preventing a major recovery from materializing. Concentrating on bonds, the upswing in real yields, gold's true kryptonite, should be a top-of-mind concern for traders focused on this commodity, especially after the 10-year TIPS soared to 1.2%, its best reading in more than 11 years.
GOLD PRICES, DXY INDEX AND REAL YIELDS CHART
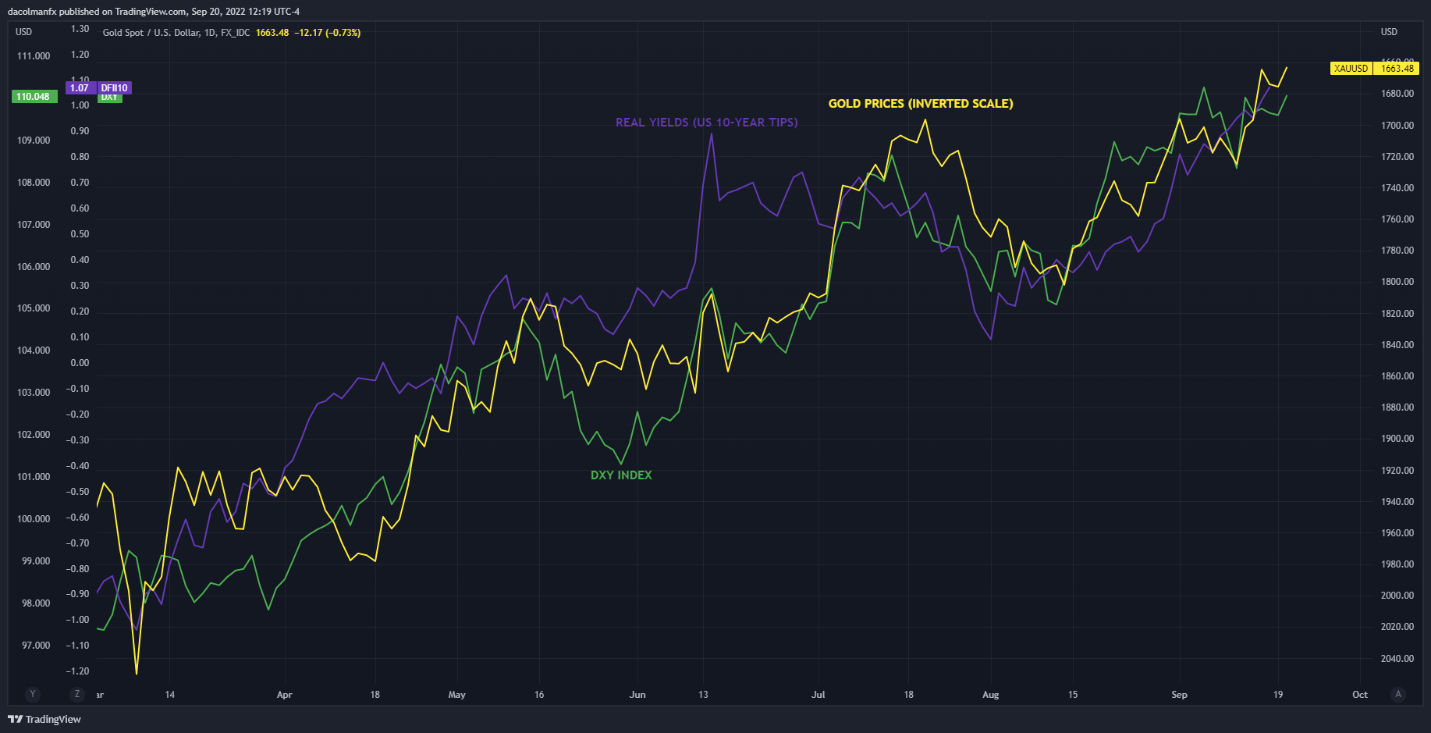
Source: TradingView

While the large moves observed in the rates space recently seen overstretched, there may still be room for more upside. For this reason, it is important to closely follow the Federal Reserve monetary policy announcement tomorrow. The bank’s forward-guidance and summary of economic projections will clarify a lot of things for Wall Street. In any case, the institution is seen raising borrowing costs by 75 basis-point to 3.00%-3.25% in its efforts to bring inflation down, but the focus should be on the tightening roadmap.
In light of persistently elevated price pressures in the U.S. economy, reflected in the disappointing August CPI report, Fed officials may endorse a steeper hiking path and a higher terminal rate than anticipated a few months ago. The FOMC could also signal that it will keep the policy stance restrictive at the peak level for a significant period of time, ruling out premature cuts. This scenario could bias real yields higher, reinforcing gold's weakness, at least in the near term. The story could change in the future once recession risks grow materially, but that is a longer-term theme now.
| Change in | Longs | Shorts | OI |
| Daily | 1% | -3% | -1% |
| Weekly | 2% | -8% | -2% |
GOLD PRICES TECHNICAL ANALYSIS
After breaking below cluster support in the $1700/$1,675 area, gold has accelerated its decline, with prices now sitting above the lower limit of a short-term descending channel near $1,650. If sellers manage to breach this key floor in the coming sessions, downside momentum could pick up pace, paving the way for a move towards $1,615, the 50% Fibonacci retracement of the 2018/2020 rally.
On the flip side, if buyers resurface and spark a bullish turnaround, initial resistance comes in at $1,675/$1,700$. On further strength, the focus shifts higher to $1,720, followed by the 50-day SMA around $1,735.
GOLD PRICES (XAU/USD) TECHNICAL CHART
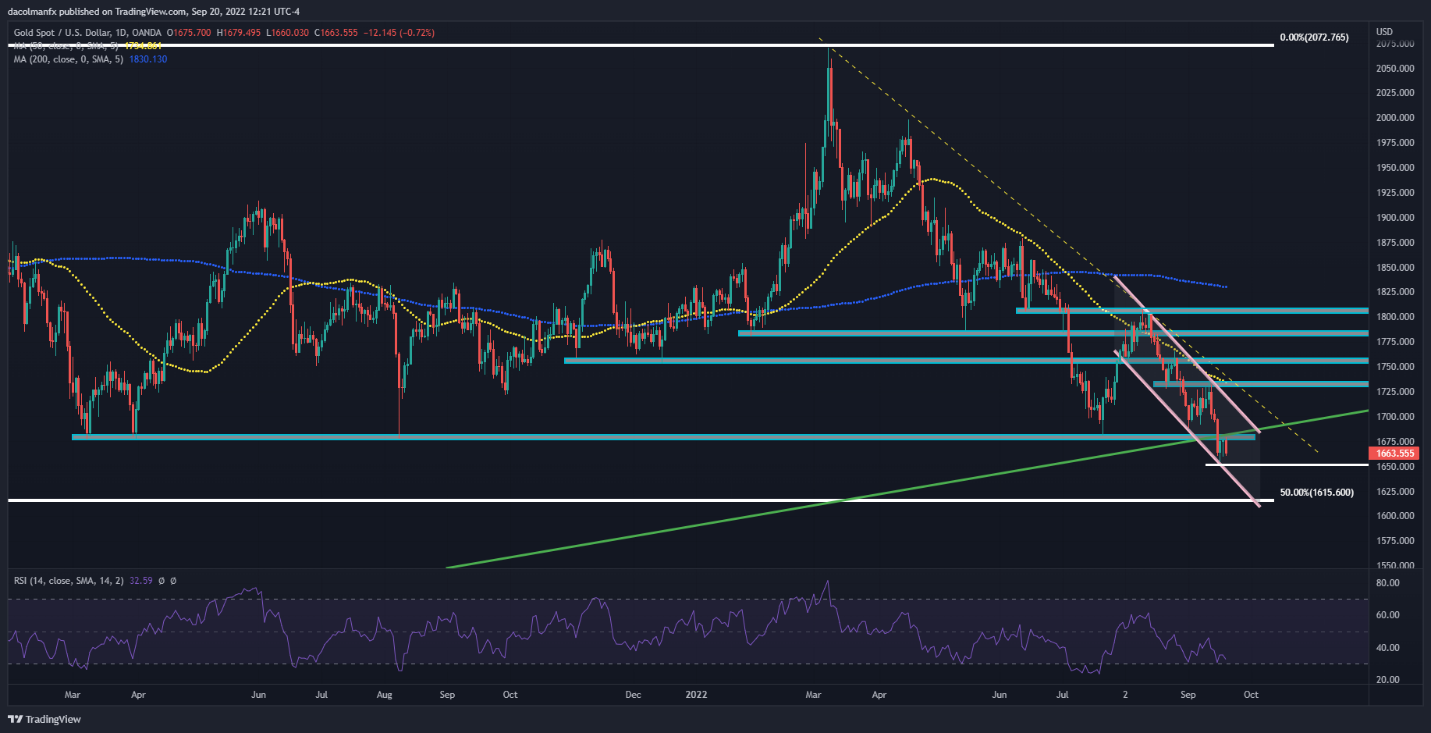
Gold Prices Chart Prepared Using TradingView
EDUCATION TOOLS FOR TRADERS
- Are you just getting started? Download the beginners’ guide for FX traders
- Would you like to know more about your trading personality? Take the DailyFX quiz and find out
- IG's client positioning data provides valuable information on market sentiment. Get your free guide on how to use this powerful trading indicator here.
---Written by Diego Colman, Market Strategist for DailyFX


