


Gold, Dollar, Fed Rates and Silver Talking Points:
- The Market Perspective: Gold Bearish Below 1,730
- Gold dropped -0.7 percent, ending a tepid recovery effort while silver dropped -2.5 percent for its wort showing in six weeks
- Interest rate speculation in the US may play a bigger role on the metals market this week than most other fundamental currents

Though gold is often afforded a general ‘safe haven’ asset, its correlation to the S&P 500 (one of the more recognizable benchmarks for ‘risk’) is actually hovering around 0.86 on a 20-day rolling basis. Given the relationship is judged on a +1 to -1 range, that would insinuate a very strong and positive correlation. That is not to say it doesn’t don that fundamental cloak in different circumstances – it has in the past – but for right now, the guidance is to be found elsewhere. It would seem the more distinct motivation is coming from interest rate forecasting. Whether you chalk that up to gold’s lack of any yield as interest rates are rising or its generic pricing in US Dollar’s as a counterbalance, the correlation between the implied Fed Funds rate for June of 2023 enjoys a more significant (inverse) relationship. That said, it is likely that we are delivered a significant interest rate forecast update this week for the Fed via key data points like the PCE deflator on Thursday as well as Fed signaling before the official media blackout starts this coming weekend (two weekends before the rate decision itself on December 14th).
Chart of Gold Overlaid with 100 and 200-Day SMAs, Inverted Fed Forecast through June 2023 (Daily)
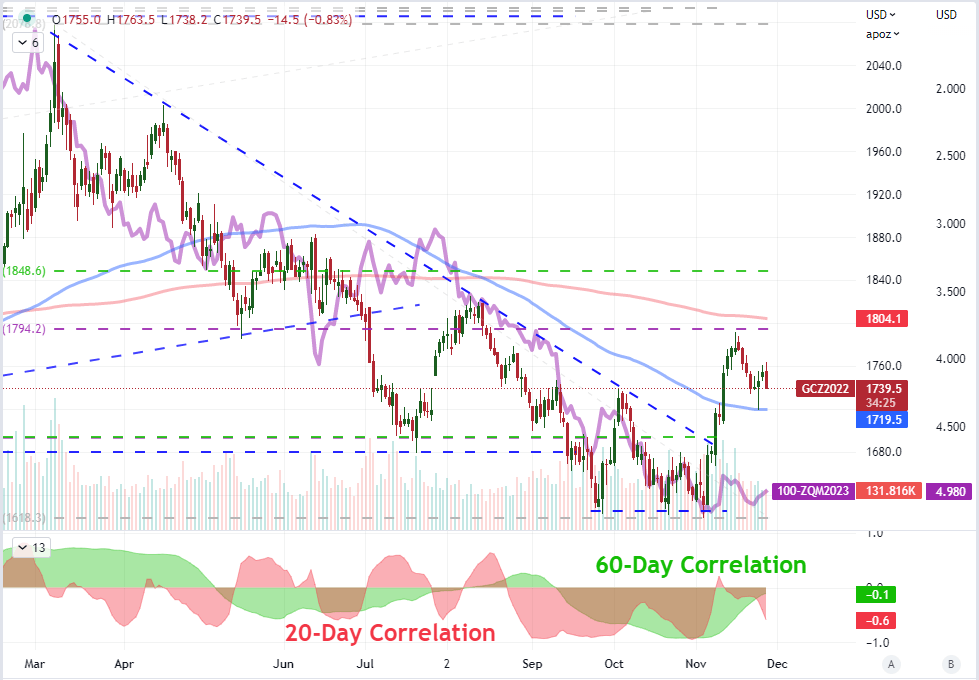
Chart Created on Tradingview Platform
For the upcoming session, there are a few US-based data points that will carry serious weight if we are gauging the country’s economic potential. However, I’m looking at the fundamental backdrop with much more of an eye towards rate projections. Fed speak in particular has thus far picked up where it left off last week. A number of officials have made a concerted effort to warn the market that the path to a terminal rate seems to be higher than they had previous expected, while outspoken hawk James Bullard went so far as to suggest the market was underpricing the risk of a higher rate on Monday. Nevertheless, retail traders seem to be either be negligent or dubious of their signals. Fed Fund futures are little budged from last week and are still pricing in rate cuts in the back half of 2023 – something that even the dovish officials have reiterated they don’t believe will happen. In speculative positioning, we can see the skepticism play out with CFD interest to short gold’s bounce significantly reduced over the past week even though we have not made any higher highs after that November 15th peak.
| Change in | Longs | Shorts | OI |
| Daily | 1% | -3% | -1% |
| Weekly | 2% | -8% | -2% |
Chart of Retail Gold CFD Trader Positioning at IG (Daily)
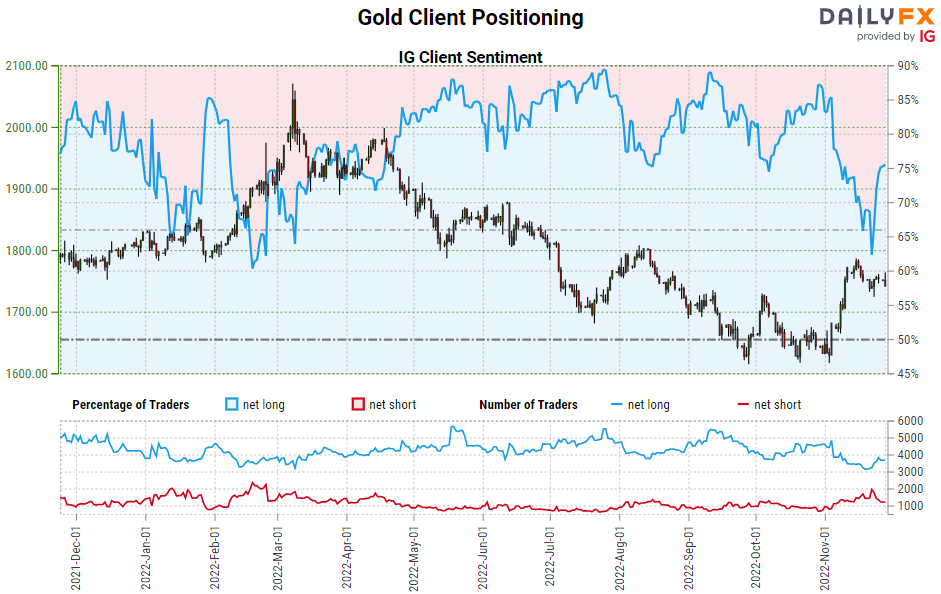
Chart Created on DailyFX.com
As a close cousin of gold, the silver market is likely also taking its cues from its more expensive cousin. The metal took a significantly steeper -2.5 percent drop Monday in more than sympathy to GC. Generally, the 20-day and 60-day (equivalent to one and three trading months) correlation between silver and gold is presently significantly positive and strong. However, the longer-term relationship is still recovering from a significant swoon from the past month. Volatility in the underlying metals market likely has a lot to do with that waver in the correlation. The more active the underlying market, the more the fundamental nuances between these two markets will come to pass. In a risk-positive swing that seems to defy the safe haven relationship gold possess, speculative interests are likely no doubt stocked for the cheaper silver counterpart. Volatility for most major markets is facing serious fundamental risk this week, so it will pay to monitor this relationship if you follow these markets.
Chart of Silver Futures Overlaid with Gold and GVZ Gold Volatility with 20 and 60-day Correl (Daily)
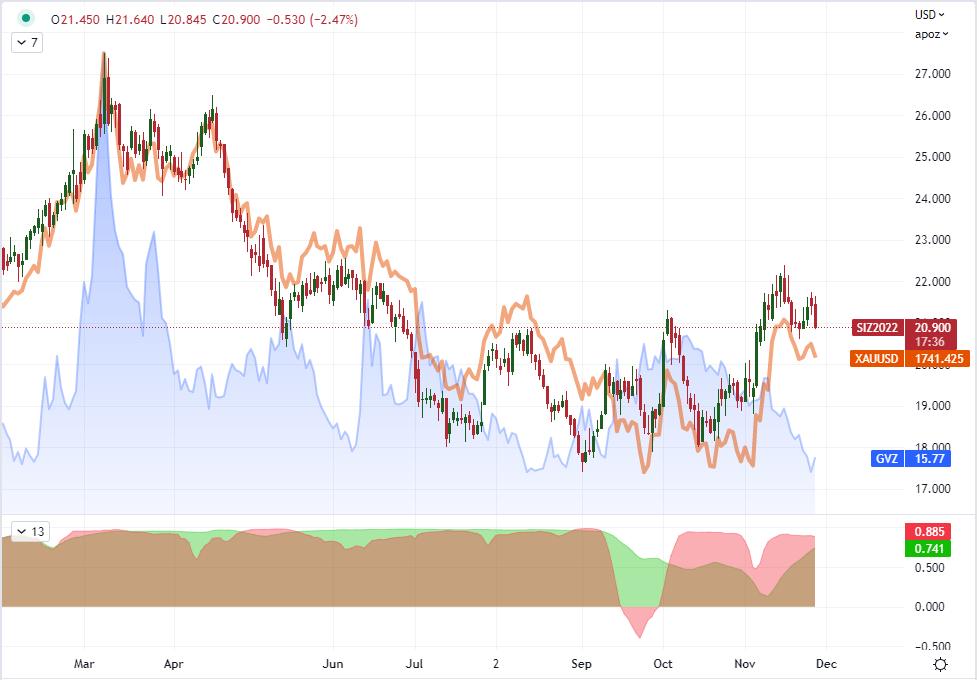
Chart Created on Tradingview Platform
Trade Smarter - Sign up for the DailyFX Newsletter
Receive timely and compelling market commentary from the DailyFX team


