Article by IG Senior Market Analyst Axel Rudolph
FTSE 100, DAX 40, Russell 2000 - Analysis and Charts
FTSE 100 resumes ascent
The FTSE 100 is heading back up towards last week’s six-week high at 7,543 as traders await more data this week to guide the economic and monetary policy outlook.The index is now trading once more above its 55-day simple moving average (SMA) at 7,485 and targets the November and current December highs at 7,535 to 7,543. Above this resistance area meanders the 200-day simple moving average (SMA) at 7,571.
Support below the 55-day SMA at 7,485 and the early November high at 7,484 comes in at Tuesday’s 7,459 low.
FTSE 100 Daily Chart

Download the Free IG Sentiment Gudie and See How Daily and Weekly Changes Affect Price Action
| Change in | Longs | Shorts | OI |
| Daily | 13% | -7% | -4% |
| Weekly | -8% | 9% | 5% |
DAX 40 trades in record highs
The DAX 40 continues to rally despite German factory orders falling for the first time in three months. The index hit a new record high above its 16,532 July peak around the 16,600 mark on Tuesday. Further up beckons the minor psychological 17,000 level.
Immediate upside pressure will be maintained while no slip through Friday’s low at 16,237 is seen. Above it minor support can be found around the 1 December high at 16,463 and at Tuesday’s 16,391 low.
DAX 40 Daily Chart


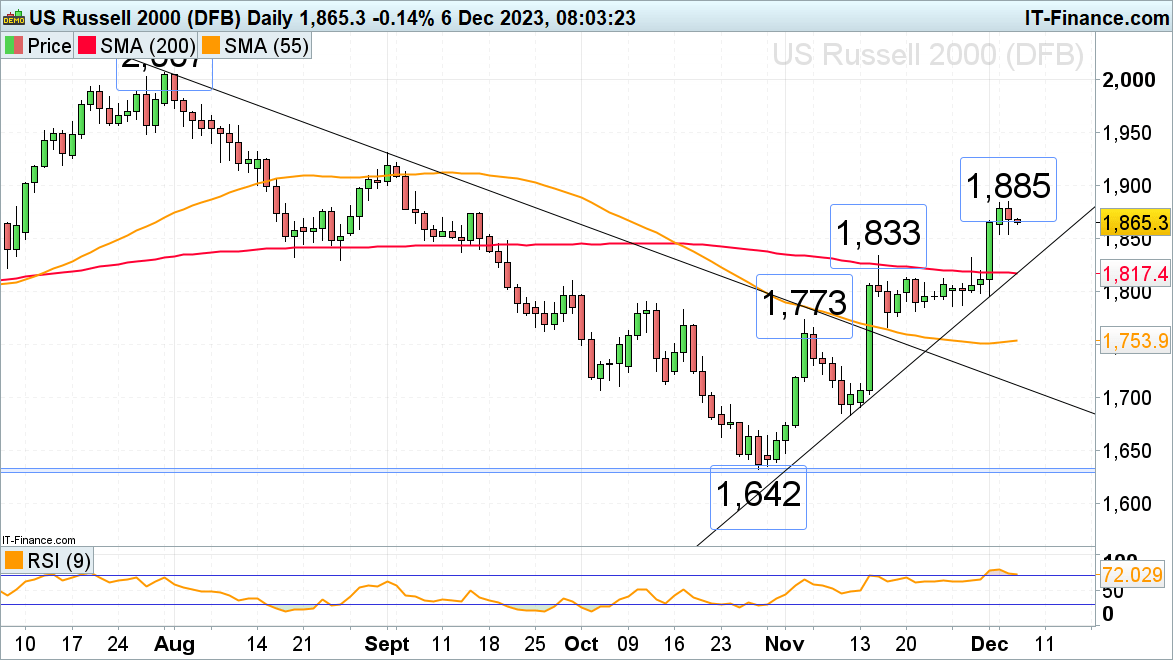
Russell 2000 trades near three-month highs
The Russell 2000, the great underperformer of US stock indices with only a 6% gain year-to-date, has now reached levels last traded in mid-September and so far risen to 1,885 despite much weaker-than-expected US JOLTS job openings. Today’s ADP employment data and, more importantly, Friday’s Non-Farm Payrolls should give investors a better indication of the state of the US labor market.
A rise above 1,885 would aim for the September peak at 1,931 whereas a fall through Tuesday’s 1,854 low may lead to the mid-November high, the 200-day simple moving average (SMA), and the November-to-December uptrend line at 1,833 to 1,817 being revisited.
Russell 2000 Daily Chart