Article by IG Senior Market Analyst Axel Rudolph
FTSE 100, DAX 40, S&P 500 Analysis and Charts
Download our Brand New Q4 Equity Forecast for Free

FTSE 100 rallies on dovish Fed view
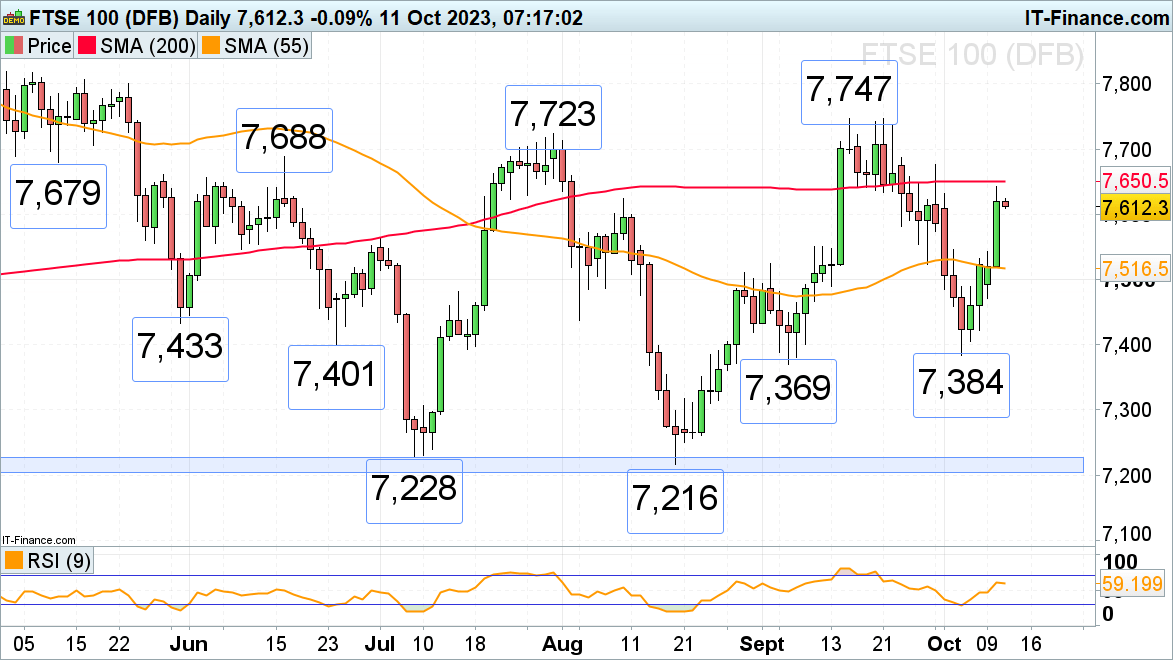
The FTSE 100 has seen four consecutive days of gains as more and more Fed members hold dovish views and some believe that the high US yields are having the desired restrictive effect with no more rate hikes expected to be seen this year. On Tuesday the UK blue chip index on came close to the 200-day simple moving average (SMA) at 7,650 which may act as resistance today. Above it sits the late September high at 7,675, a rise above which would engage the mid-June high at 7,688. Further up lie the July and September highs at 7,723 to 7,747.
Slips should find support between the 7,562 early July high and the 7,550 11 September high.
FTSE 100 Daily Chart
See How IG Client Sentiment Can Help Your Trading
| Change in | Longs | Shorts | OI |
| Daily | -1% | 2% | 1% |
| Weekly | -16% | 10% | 6% |
DAX 40 rally is taking a breather
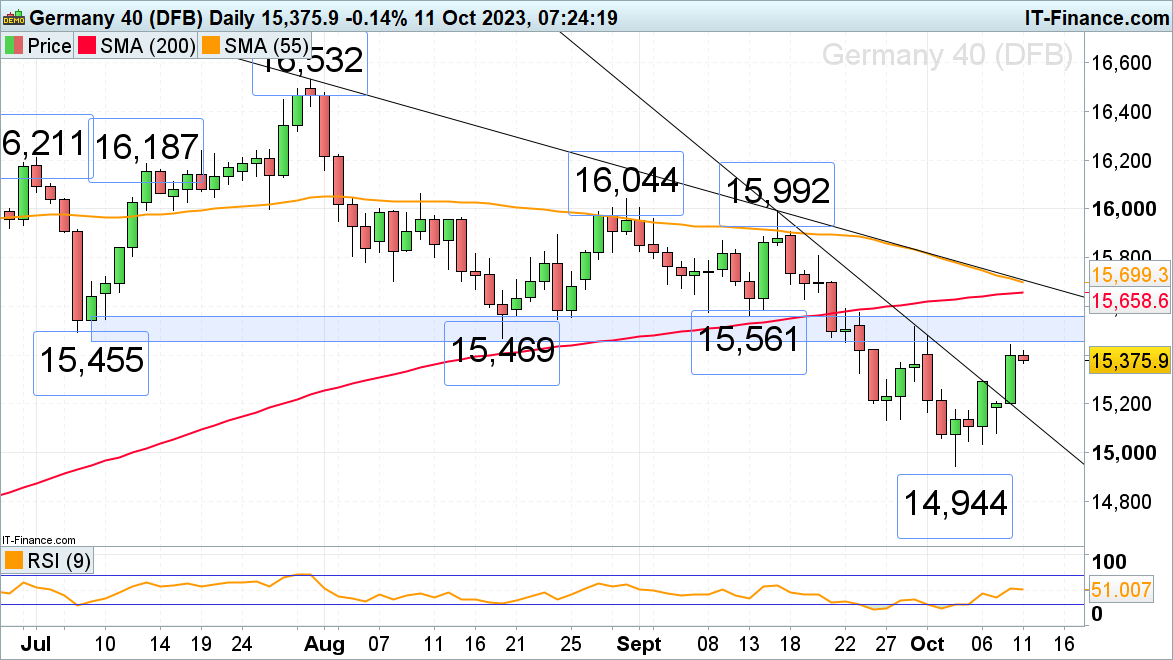
The DAX 40 has rallied close to its major 15,455 to 15,561 resistance area, made up of the July to mid-September lows, in line with Wall Street and Asian equity indices amid dovish Fed commentary. This resistance zone should not prove easy to overcome, though, and may thus cap on Wednesday. Slips back towards Friday’s high at 15,296 may thus ensue. Further down lies minor support at last Tuesday’s 15,259 high.
Were a rise and daily chart close above the 15,561 mid-September low to be made, the 200- and 55-day simple moving averages as well as the July-to-October downtrend line at 15,658 to 15,700 would be targeted.
DAX 40 Daily Chart

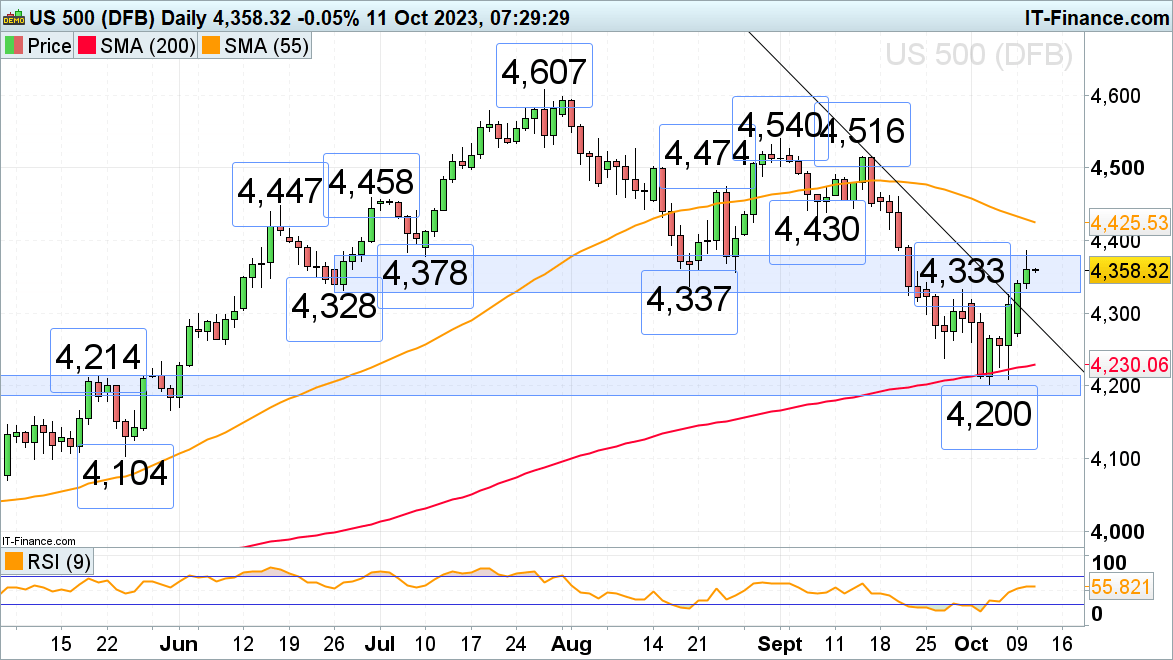
S&P 500 grapples with the 4,328 to 4,378 resistance area
The S&P 500 has entered the key 4,328 to 4,378 resistance area, consisting of the late June to August lows and late September high, which so far caps despite four Federal Reserve (Fed) voting members making dovish comments. Were a rise above Tuesday’s high at 4,386 to be seen, the 55-day simple moving average (SMA) at 4,425 would be next in line.
Minor support can now be found between the 4,337 to 4,328 late June and August lows.
S&P 500 Daily Chart