Article by IG Senior Market Analyst Axel Rudolph
FTSE 100, DAX 40, Russell 2000 Analysis and Charts
FTSE 100 falls out of bed on hawkish Fed
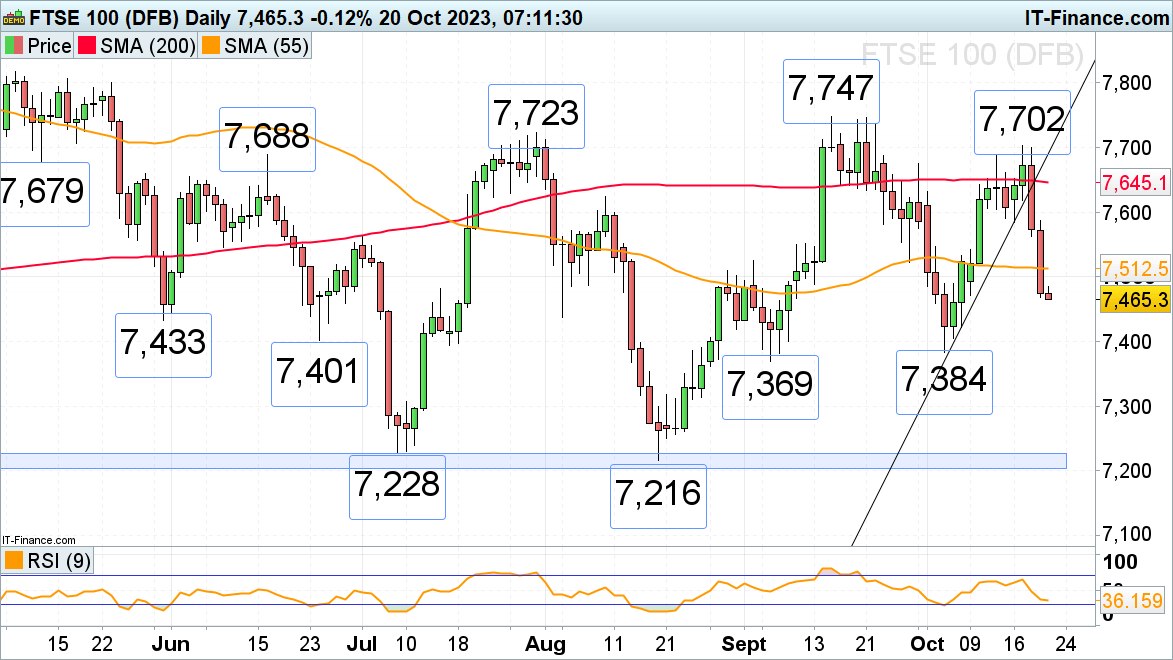
The FTSE 100 once again failed in the 7,700 region and dropped by over 2.5% over the past couple of days as the US Federal Reserve (Fed) re-iterates its hawkish stance and US bond yields surge to 2006 and 2007 highs.The FTSE 100 is in the process of slipping to the May and early August lows at 7,438 to 7,433. Below this area lies the 7,401 late June low and further down the key September and October lows at 7,384 to 7,369.
Minor resistance can be seen along the 55-day simple moving average (SMA) at 7,512 and at the 7,524 early September high.
FTSE 100 Daily Chart

DAX 40 drops to a seven-month low
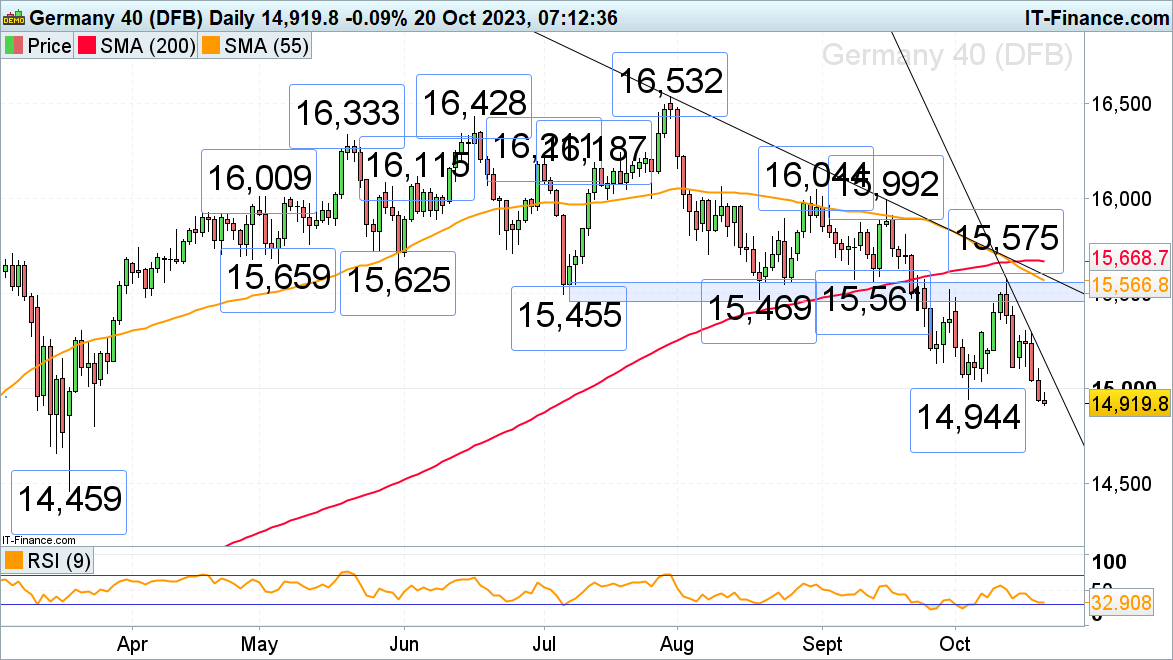
The DAX 40’s fall through its early October 14,944 low as investors brace themselves for a ‘rates higher for longer’ period well into the second half of next year. It puts the late March low at 14,801 on the cards. Below it lies the March trough at 14,459.
Minor resistance can now be found between the 6 October low at 15,034 and the accelerated downtrend line at 15,140.
DAX 40 Daily Chart
| Change in | Longs | Shorts | OI |
| Daily | -5% | 4% | 2% |
| Weekly | -37% | 36% | 11% |
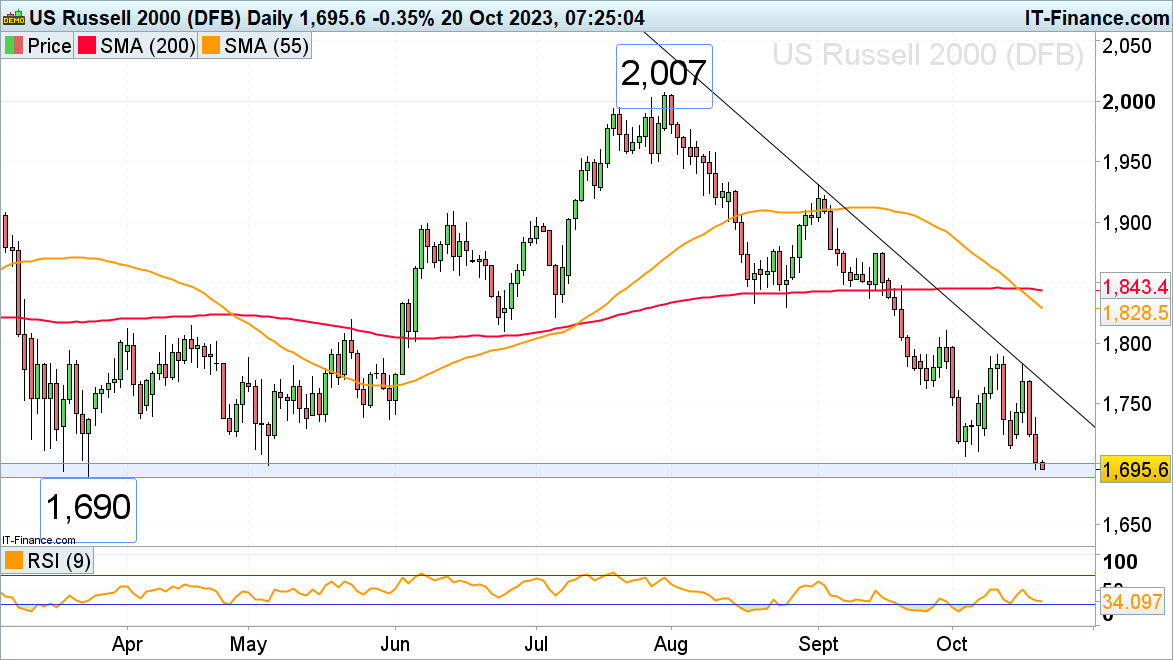
Russell 2000 re-enters major 2022-to-2023 support zone
The Russell 2000, the great underperformer of US stock indices with a near 3% negative performance year-to-date, has slid back to its major December 2022 to May support zone at 1,700 to 1,690. It did so amid hawkish comments by the Fed Chair Jerome Powell who said that inflation remains too high and that it needs to be brought down, leading the 10-year US Treasury yield to hit the 5% level, last seen in 2007.Were a drop through and daily chart close below the 1,690 March low to ensue, the June-to-October 2022 lows at 1,639 to 1,631 would be back in sight.
Minor resistance above the 1,707 early October low sits at the 1,713 mid-October low.
Russell 2000 Daily Chart