Article by IG Senior Market Analyst Axel Rudolph
FTSE 100, Dax 40, and S&P 500 Analysis and Charts
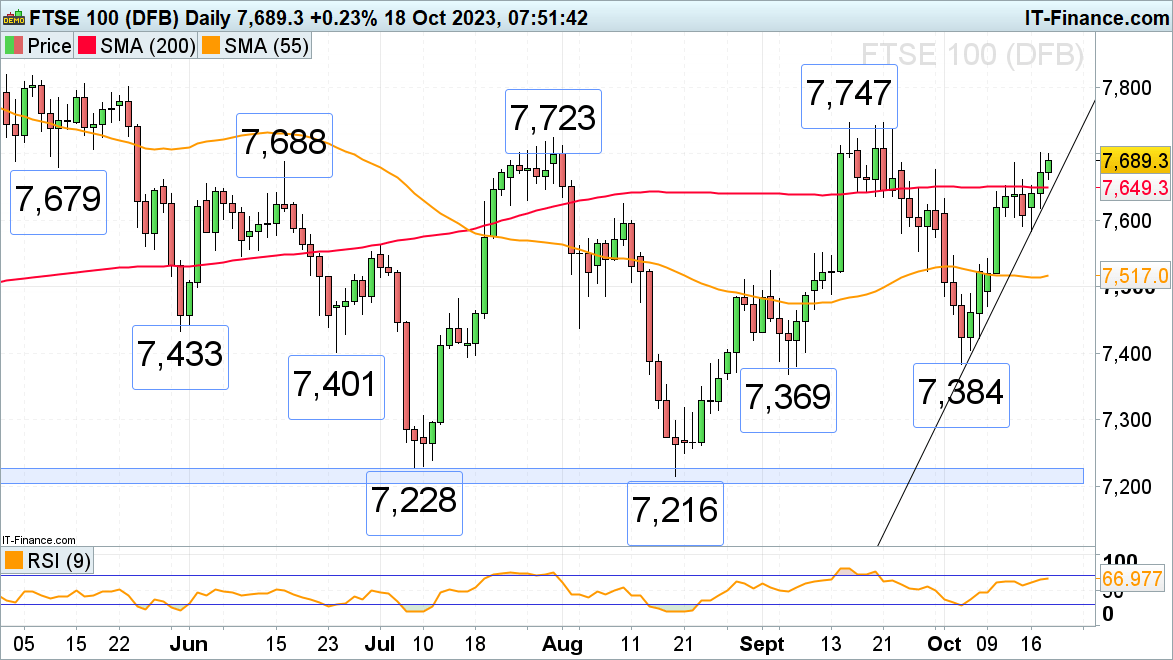
FTSE 100 trades near one-month high
The FTSE 100, which continues to benefit from the higher oil price, is approaching the July and September highs at 7,723 to 7,747 which are expected to act as resistance, at least in the short-term. The rise is seen despite UK inflation for September remaining unchanged at 6.7% versus expectations of a slight decrease to 6.6%, as softer increases in food and furniture prices were offset by a rebound in transport costs.
Slips should find support between the October accelerated uptrend line and the 200-day simple moving average (SMA) at 7,650 to 7,638. While Monday’s low at 7,584 underpins, the current uptrend will remain intact.
FTSE 100 Daily Chart
Download our Top Trading Tips for Free

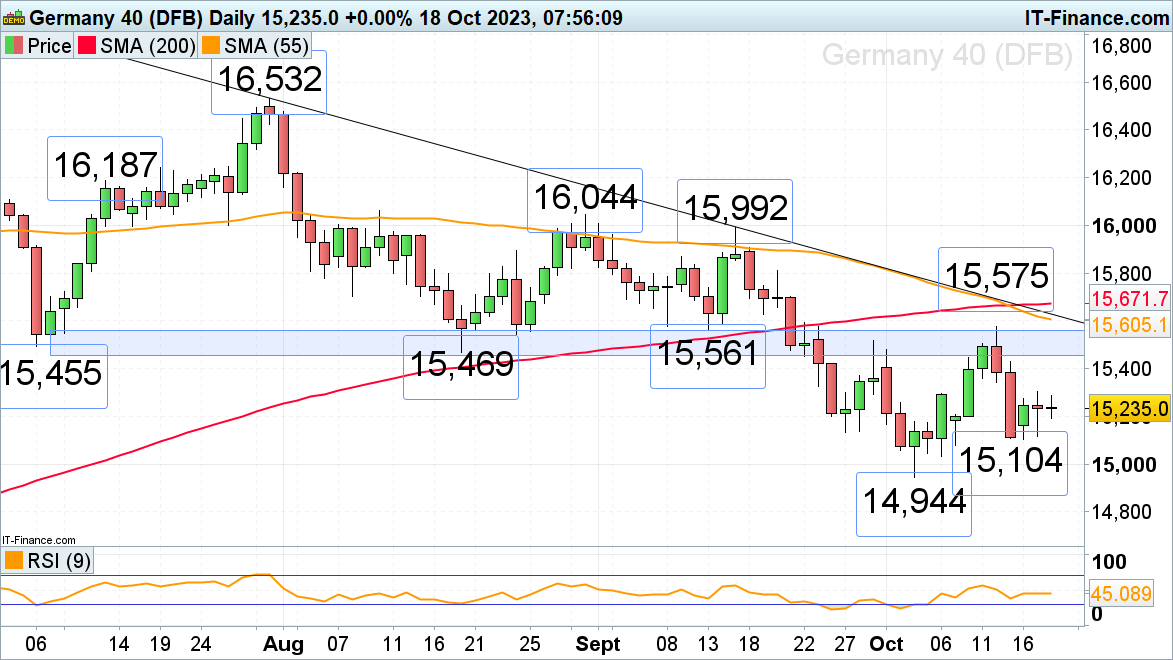
DAX 40 still hovers above Monday’s 15,104 low
The DAX 40, which on Monday dipped down to 15,104 amid heightened Middle East tensions, continues to hover above this low amid cautious trading. Provided that the 15,104 low continues to underpin on a daily chart closing basis, Tuesday’s high at 15,305 could be revisited. Above it lies the major 15,455 to 15,575 resistance area which encompasses the July to mid-September lows and last week’s high.
A slide through 15,104 would probably lead to the early October low at 14,944 being back on the map.
DAX 40 Daily Chart
| Change in | Longs | Shorts | OI |
| Daily | -16% | 12% | 5% |
| Weekly | -26% | 38% | 18% |
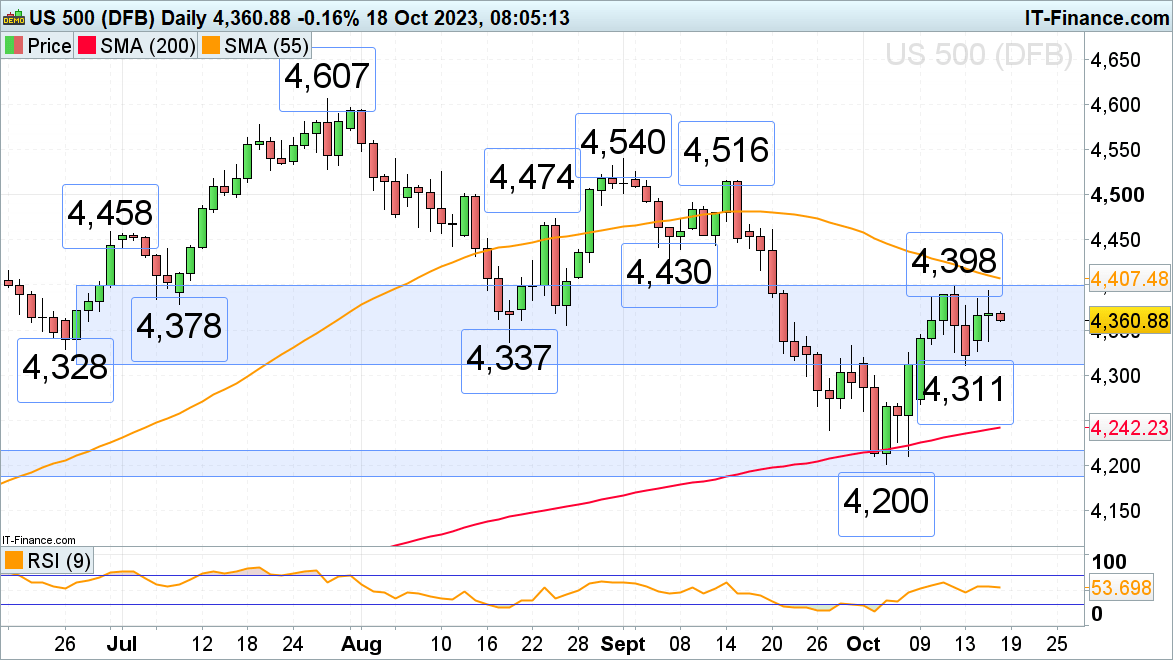
S&P 500 is contained by the 4,311 to 4,398 resistance area
The S&P 500 continues to trade within its 4,311 to 4,398 resistance area, made up of the late June to August lows, late September high and mid-October high and low, as Q3 earnings season so far seems to surprise to the upside.A rise above 4,398 and the 55-day simple moving average (SMA) at 4,407 would eye the 4,430 early September low.
Good support can be spotted between the 4,337 to 4,311 mid-August to Friday’s low.
S&P 500 Daily Chart