


GOLD ANALYSIS & TALKING POINTS
- U.S. economic data points will continue to shape the USD landscape and impact gold prices.
- Technical analysis suggests mounting bearish indications.
- Rising wedge chart pattern could suggest further downside to come.

XAU/USD FUNDAMENTAL BACKDROP
Gold has been closely echoing dollar based inputs including recent positive U.S. economic data. Yesterday’s ISM services PMI was significant considering the economy is primarily services driven, gave a boost to the greenback after beating expectations. This compounded the tight labor market reinforced by last week’s Non-Farm Payrolls (NFP). Recent Fed talk around moderating interest rate hikes has now placed this outlook under scrutiny with possibly more hawkishness to come. The resultant effect has been the Fed’s terminal rate rising back above the 5% level once more and without any Fed officials scheduled to speak leading up to December 14 meeting, price action for XAU/USD will be primarily driven by economic data and technical levels.
Trade Smarter - Sign up for the DailyFX Newsletter
Receive timely and compelling market commentary from the DailyFX team
The core inflation print will serve as an important contribution prior to the Fed’s rate decision after inflationary pressures have softened.
ECONOMIC CALENDAR
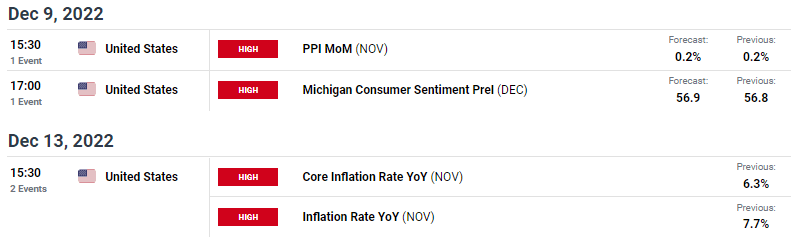
Source: DailyFX economic calendar
TECHNICAL ANALYSIS
XAU/USD DAILY CHART
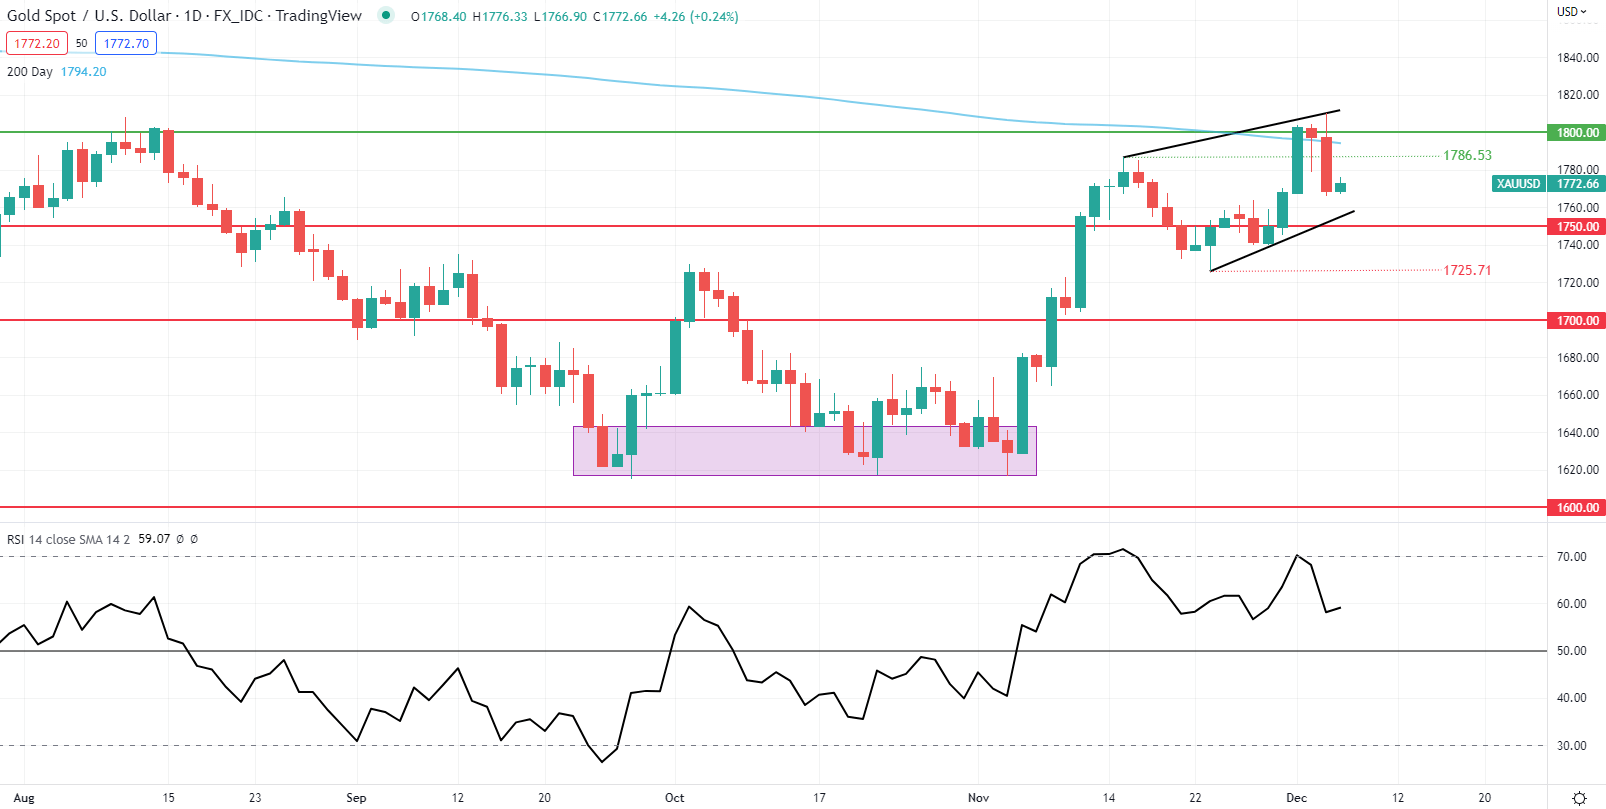
Chart prepared by Warren Venketas, IG
Price action on the daily spot gold chart shows the formation and continued development within the rising wedge formation (black). A break below wedge support could open up the 1750.00 psychological handle. The Relative Strength Index (RSI) is exhibiting slowing bullish momentum suggesting possible bearish divergence which supports a more bearish outlook.
Failure by bulls at the 200-day SMA (blue) again provides backing for the short-term downside bias.
Introduction to Technical Analysis
Candlestick Patterns
Recommended by Warren Venketas
Resistance levels:
- 200-day SMA
- 1786.53
Support levels:
- Wedge support
- 1750.00
- 1725.71
IG CLIENT SENTIMENT: BEARISH
IGCS shows retail traders are currently distinctly LONG on gold, with 76% of traders currently holding long positions (as of this writing). At DailyFX we typically take a contrarian view to crowd sentiment resulting in a short-term bearish bias.
Contact and follow Warren on Twitter: @WVenketas


