
GOLD PRICE FORECAST:
- Gold prices slide as U.S. yields resume rebound following better-than-expected data
- U.S. dollar strength also weigh on precious metals
- This article looks at key XAU/USD’s tech levels to watch in the coming days

Most Read: How to Trade Gold - Top Gold Trading Strategies and Tips
After a strong performance earlier in the week, gold prices (XAU/USD) were subdued on Thursday, falling roughly 0.5% to $1,967, undercut by soaring U.S. bond yields and U.S. dollar strength following better-than-expected economic figures in the United States.
In the morning, a Department of Labor report showed that the number of Americans filing for unemployment benefits unexpectedly declined in the week ended July 15, falling to 228,000 from the previous 237,000 versus the expected 242,000, registering the lowest level since mid-May, a sign that widespread layoffs are not yet occurring.
Benign labor market data sent U.S. Treasury yields on a strong rally, especially those at the front end of the curve, boosting the U.S. dollar in the process. Traders speculated that the remarkable resilience of the U.S. economy would push the Federal Reserve to tighten again in the fall and keep rates elevated for longer in its fight against inflation.
Related: Bitcoin vs Gold - Top Differences Traders Should Know
We will have more information to assess the Fed's roadmap next week when the central bank announces its monetary policy decision, but one thing is clear: if the institution indicates more work is needed to restore price stability and signals support for additional tightening, gold could be in for a whacking.
Focusing on next week’s FOMC meeting, the bank is seen raising its key benchmark rate by 25 basis points to a range of 5.25% to 5.50%, the highest level since 2001. This scenario is already fully priced in, so the important thing for markets will be the outlook. If guidance remains hawkish, expectations for the terminal rate could drift higher, creating a hostile environment for precious metals.

INCOMING US ECONOMIC EVENTS
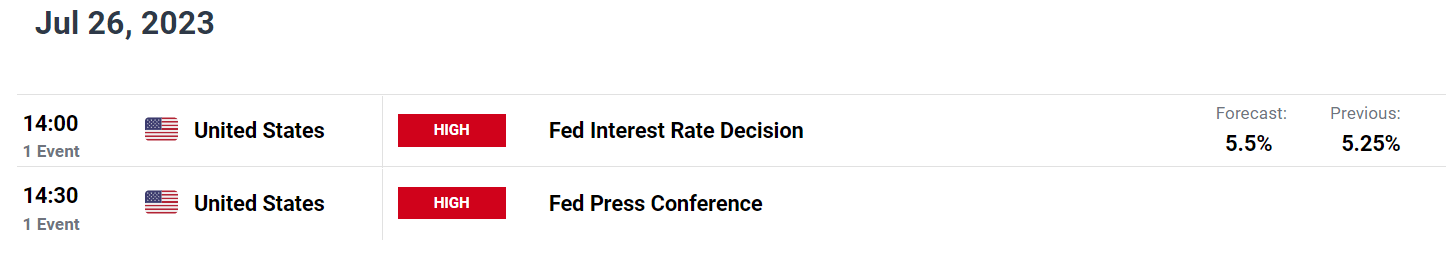
Source: DailyFX Economic Calendar
| Change in | Longs | Shorts | OI |
| Daily | 14% | -7% | 4% |
| Weekly | 6% | -2% | 3% |
GOLD PRICES TECHNICAL ANALYSIS
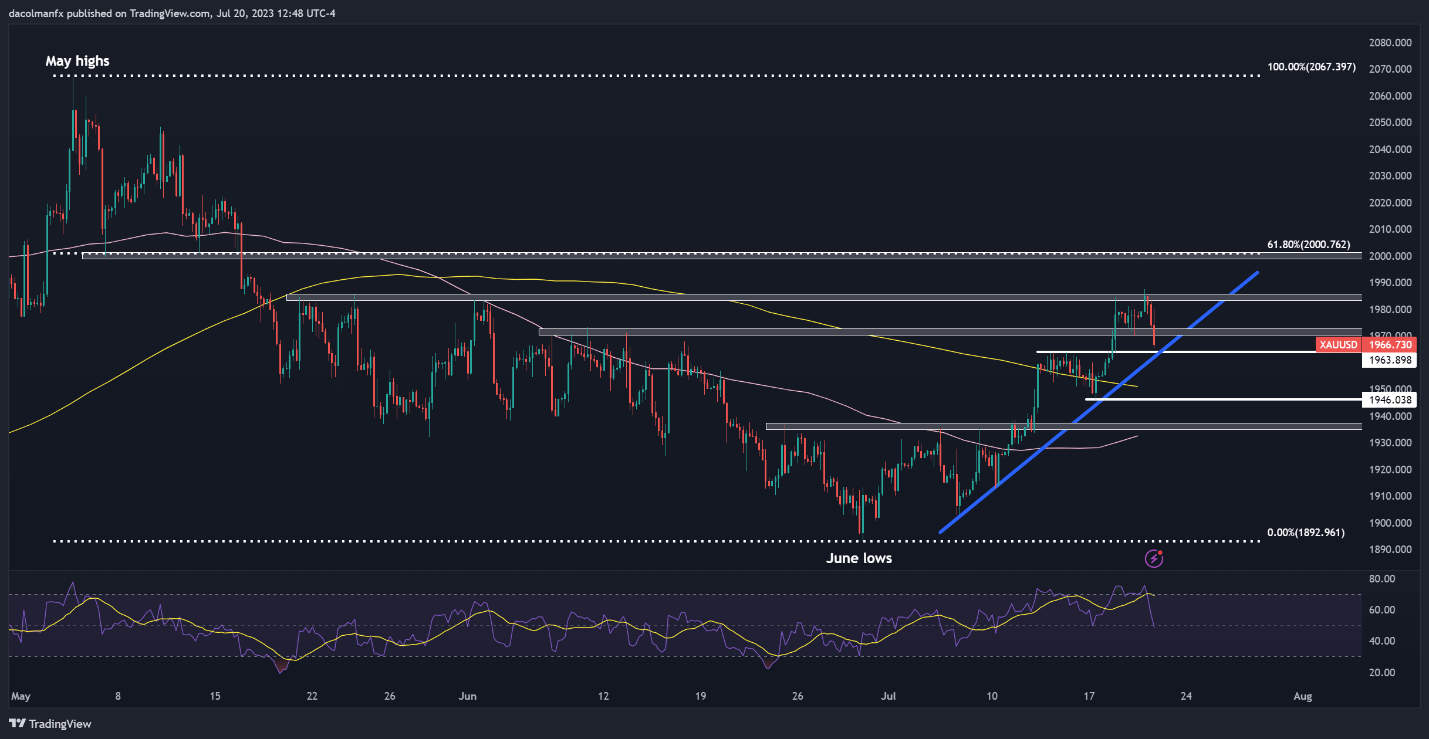
Gold ended its rebound and pivoted lower after failing to clear technical resistance at ~$1,985 earlier in the week, an area that has halted advances on multiple occasions in May, June and this month.
Following this rejection, XAU/USD has started to pull back towards trendline support at ~$1,965, as seen on the 4-hour chart below. While prices may establish a base around these levels before resuming their ascent, a breakdown could reinforce bearish pressure, paving the way for a move towards ~$1,945, followed by ~$1,935.
On the flip side, if buyers regain control of the market and trigger a bullish reversal, initial resistance appears at ~$1,973 and ~$1,985 thereafter, as mentioned before. Successfully piloting above this barrier could rekindle upward momentum, creating the right conditions for a rally toward the psychological $2,000 mark, which also aligns with the 61.8% Fib retracement of the May/June selloff.
GOLD PRICES TECHNICAL CHART