


GOLD (XAU/USD) KEY POINTS:
- Gold (XAU/USD) Attempts at a Range Breakout Fall Short as US Yields and the DXY Bounce.
- US 10Y Yield Back Below the 4% mark.
- Bull Flag and Price Action Still Hint at Upside Breakout but Macro Factors Are Likely to Drive the Move with US CPI Ahead.
- To Learn More About Price Action, Chart Patterns and Moving Averages, Check out the DailyFX Education Section.

READ MORE: EUR/USD Hits Fresh 2-Month High, Time for a Pullback?
Gold prices started the morning with a bang as US Treasury Yields fell from recent highs, with the US 10Y dropping below the 4% mark and around 1% on the day. The US open has seen the Dollar Index bounce from its daily lows however with Gold finding resistance at the recent range high around the $1940 handle. Much like markets in general of late, todays move higher in Gold prices appear to lack the conviction needed for a break of the $1940 mark.
US 2Y and 10Y Yields
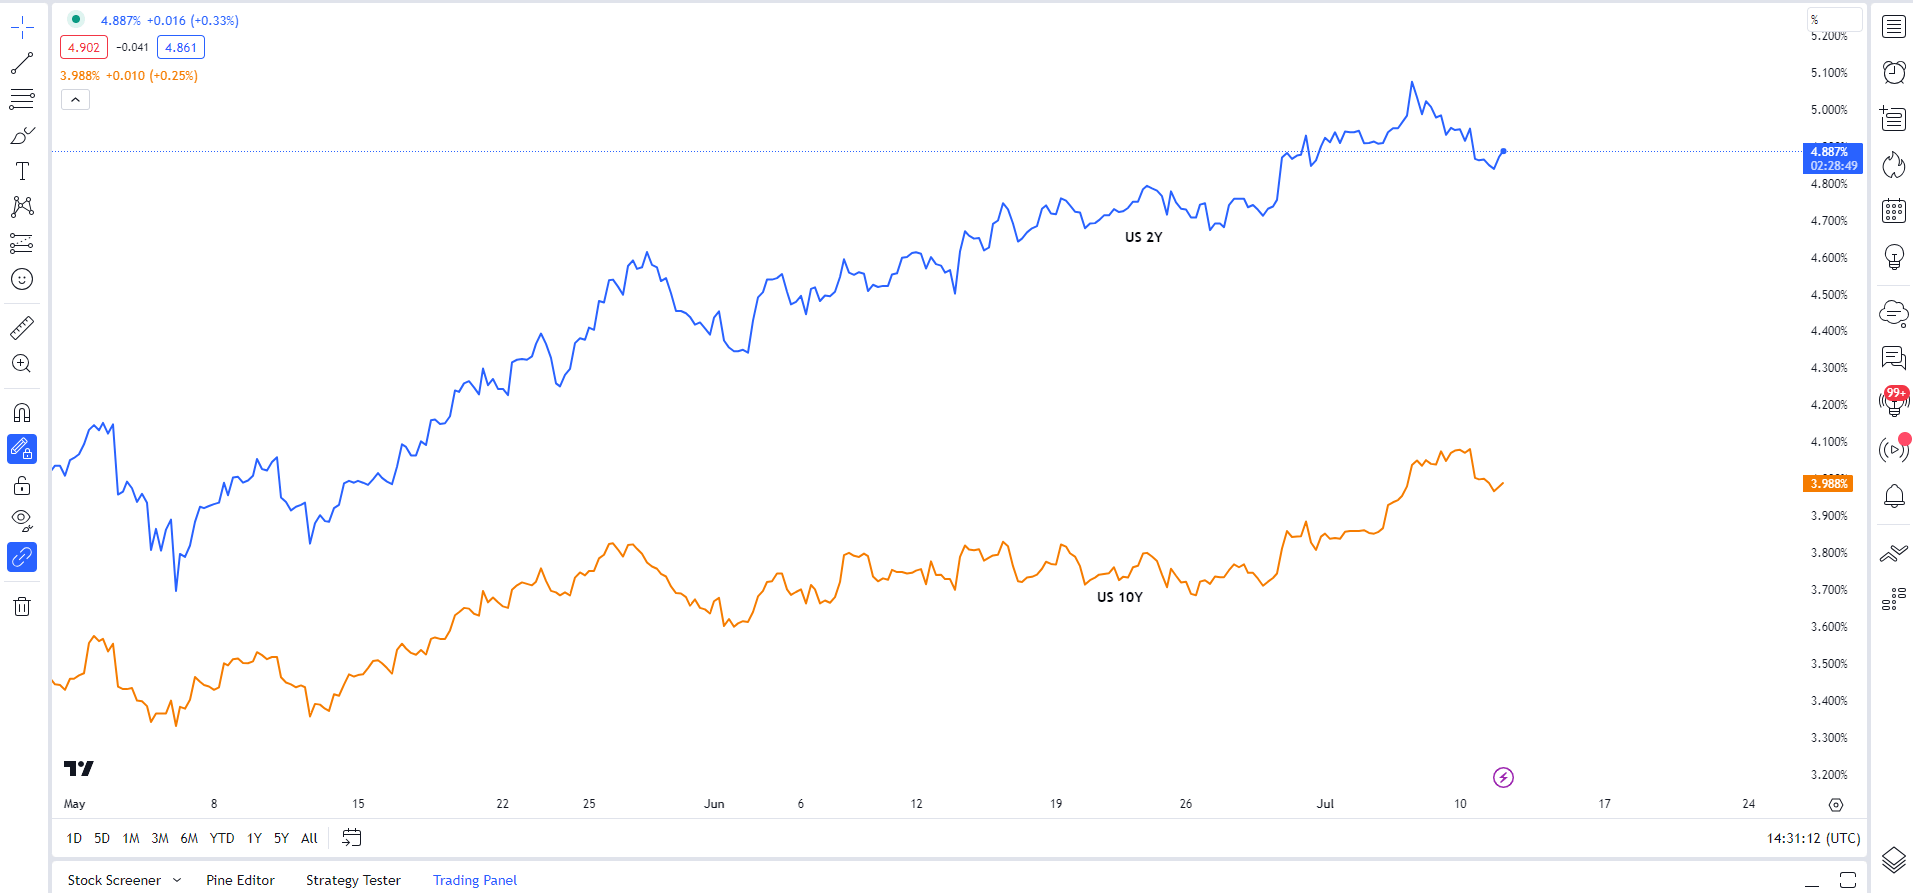
Source: TradingView, Prepared by Zain Vawda
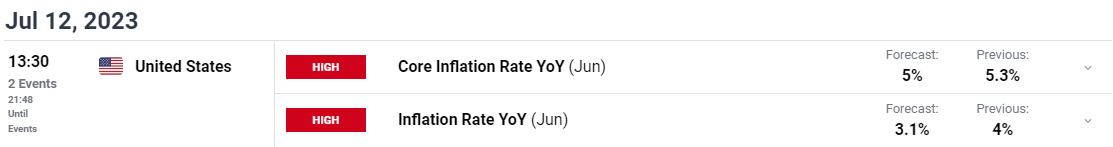
Gold has remained confined to the range between $1890 and $1940 for the better part of 3 weeks. The pair has attempted a break of the range on either side to no avail as markets remain cautious ahead of a busy month of Central Bank meetings. US CPI could serve as a catalyst tomorrow with expectations hinting at a softer print which could push Gold back above the $1940 handle.
The lack of follow through of late has seen anticipation build for another bullish rally for the precious metal toward the $2000/oz mark. However, with the Fed poised to return with a rate hike this month following a pause in June, any rally in the interim may prove short-lived.
Not much ahead in the US session in terms of event risk with attention likely turning to the US CPI release tomorrow.
For all market-moving economic releases and events, see the DailyFX Calendar

TECHNICAL OUTLOOK AND FINAL THOUGHTS
Form a technical perspective, Gold prices do appear poised for a breakout with a bullish flag pattern and price action hinting as much. We have printed higher highs and higher lows since dipping below the psychological $1900/oz level on June 29.
The only concern I do have regarding an upside breakout at this stage is the key confluence area around $1950 which lines with the 100-day MA, while the 50-day MA rests a little higher at $1959. A break higher could bring resistance around the $1980 handle into play.
Gold (XAU/USD) Daily Chart – July 11, 2023
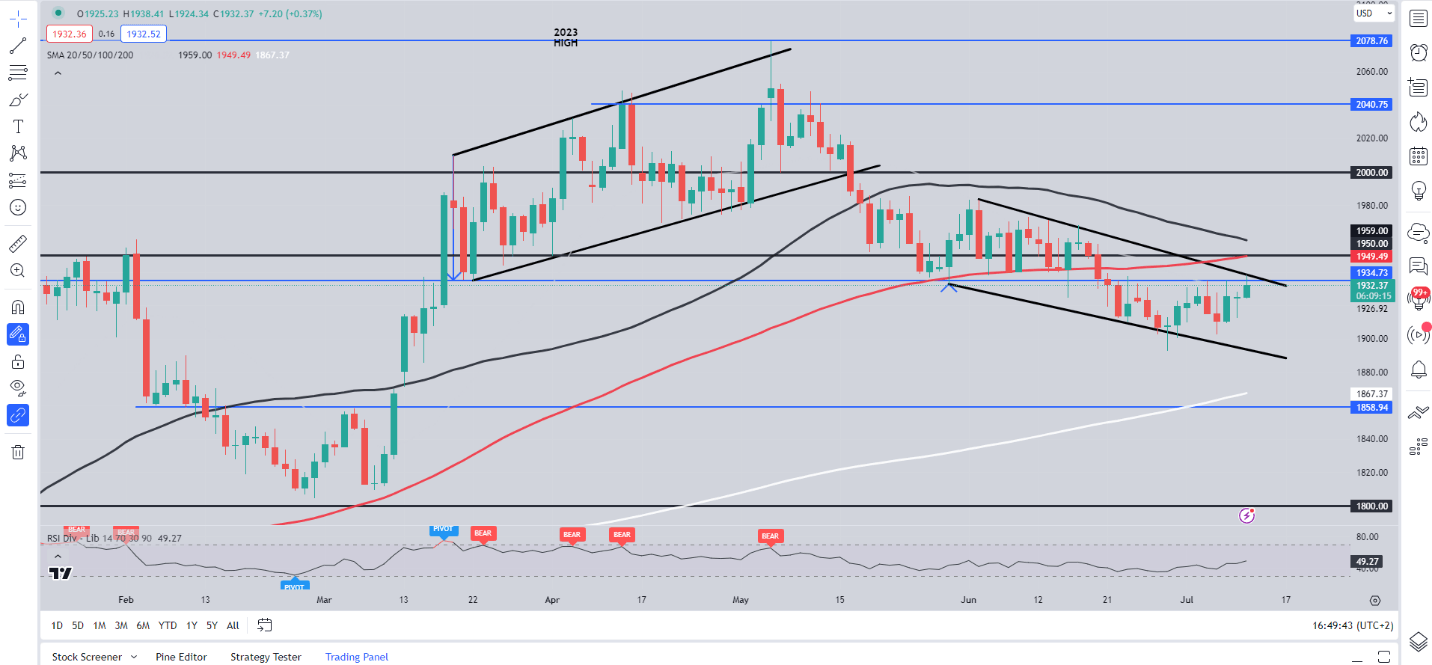
Source: TradingView, Chart Prepared by Zain Vawda
IG CLIENT SENTIMENT DATA
Taking a look at the IG client sentiment data and we can see that retail traders are currently net LONG on Gold with 68% of traders holding long positions (as of this writing). At DailyFX we typically take a contrarian view to crowd sentiment meaning we could see Gold prices continue to decline following a short upside rally.
Written by: Zain Vawda, Markets Writer for DailyFX.com
Contact and follow Zain on Twitter: @zvawda


