


Trade Smarter - Sign up for the DailyFX Newsletter
Receive timely and compelling market commentary from the DailyFX team
GOLD PRICE FORECAST
Gold advanced on Monday on the back of a weaker U.S. dollar, but gains were limited as traders avoided taking large directional positions ahead of Wednesday's U.S. inflation data, which may have a significant impact on financial markets and set the tone for precious metals.
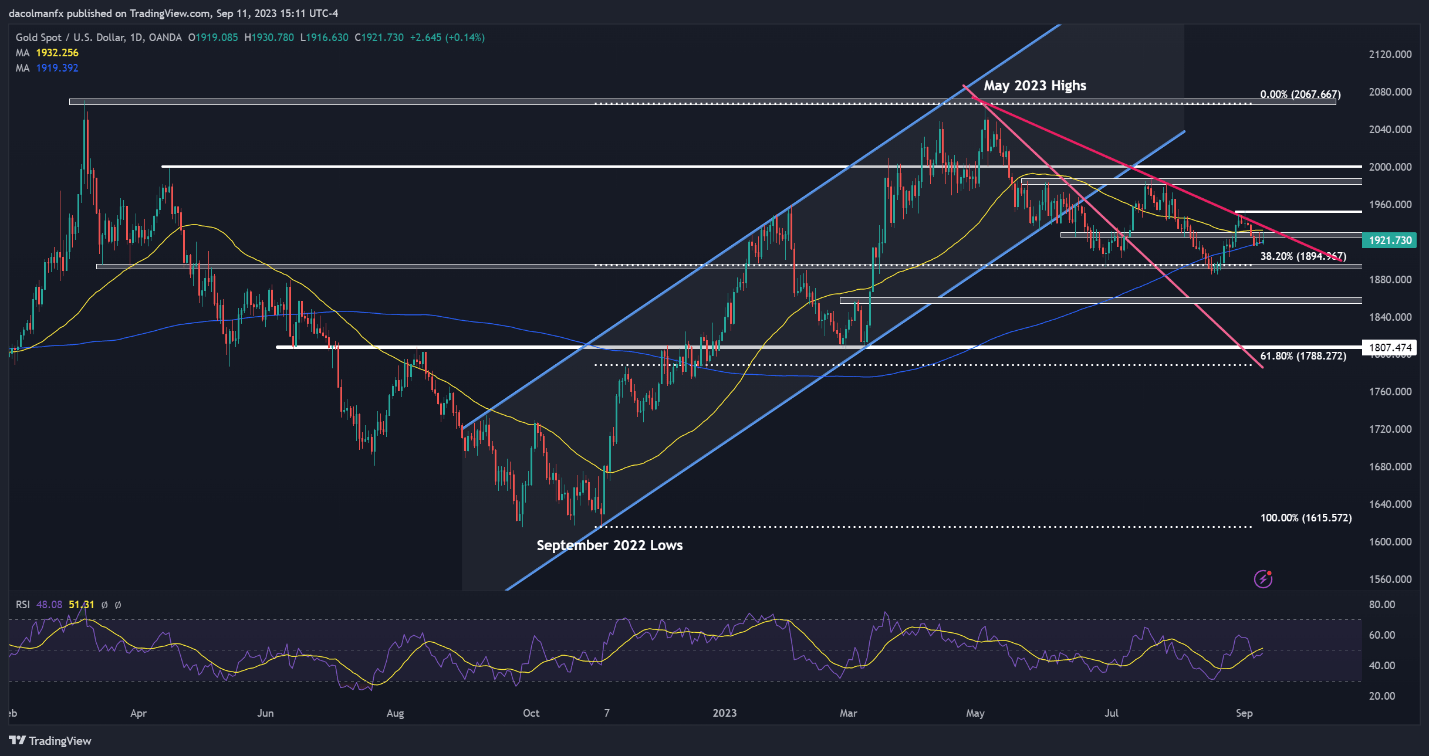
A closer look at XAU/USD's daily chart reveals a lack of conviction in recent days, with volatility subdued and prices wavering around technical resistance at $1,925/$1,935, where the 50-day simple moving average converges with a short-term descending trendline extended off the May highs.
For short-term guidance, traders should closely monitor how bullion behaves in the coming sessions, considering two possible scenarios: upside clearance of the $1,925/$1,935 region or a bearish rejection from these levels.
Uncover strategies behind consistent trading. Download your “How to Trade Gold” guide for crucial insights and tips!

In the event of a bullish breakout, upward momentum could gather pace, opening the door for a move towards $1,955, followed by $1,985. On further strength, buyers may gain the conviction to aim for the psychological $2,000 threshold.
On the flip side, if gold gets repelled by resistance and dips below the 200-day simple moving average in the process, support looms at $1,895, the 38.2% Fibonacci retracement of the September 2022/May 2023 rally. Moving further down, the next key floor is positioned around $1,855.
GOLD PRICE OUTLOOK - TECHNICAL CHART
Gold Price Chart Prepared Using TradingView
Gain a trading advantage by exploring market positioning. Download the sentiment guide to decode gold price behavior. It is totally free!
| Change in | Longs | Shorts | OI |
| Daily | 1% | -3% | -1% |
| Weekly | 2% | -8% | -2% |


