


GBP/USD - Prices, Charts, and Analysis
- Short-term lower highs and higher lows are set to collide.
- Retail positioning is finely balanced.

Cable (GBP/USD) is currently making a short-term bullish pennant formation that suggests that the pair are set to continue the recent move higher. The formation, formed by a series of lower highs and higher lows, usually occurs during a strong uptrend and this can be seen on the daily GBP/USD chart with the sharp move higher from the multi-decade low print at 1.0355 made on September 26. The recent period of consolidation adds to the formation’s credibility, and with the apex of the symmetrical triangle very close, a breakout is seen as likely.

If the pattern plays out, then the first level to watch is the November high at 1.2029, followed by the 200-day sma, currently at 1.2205, followed by horizontal resistance off the August 1 and August 10 double-high at 1.2292. In the event of a break lower, negating the bullish pennant, support starts at 1.1740 and is followed by 1.1650.
For all market-moving data releases and economic events see the DailyFX Calendar.
GBP/USD Daily Price Chart – November 22, 2022
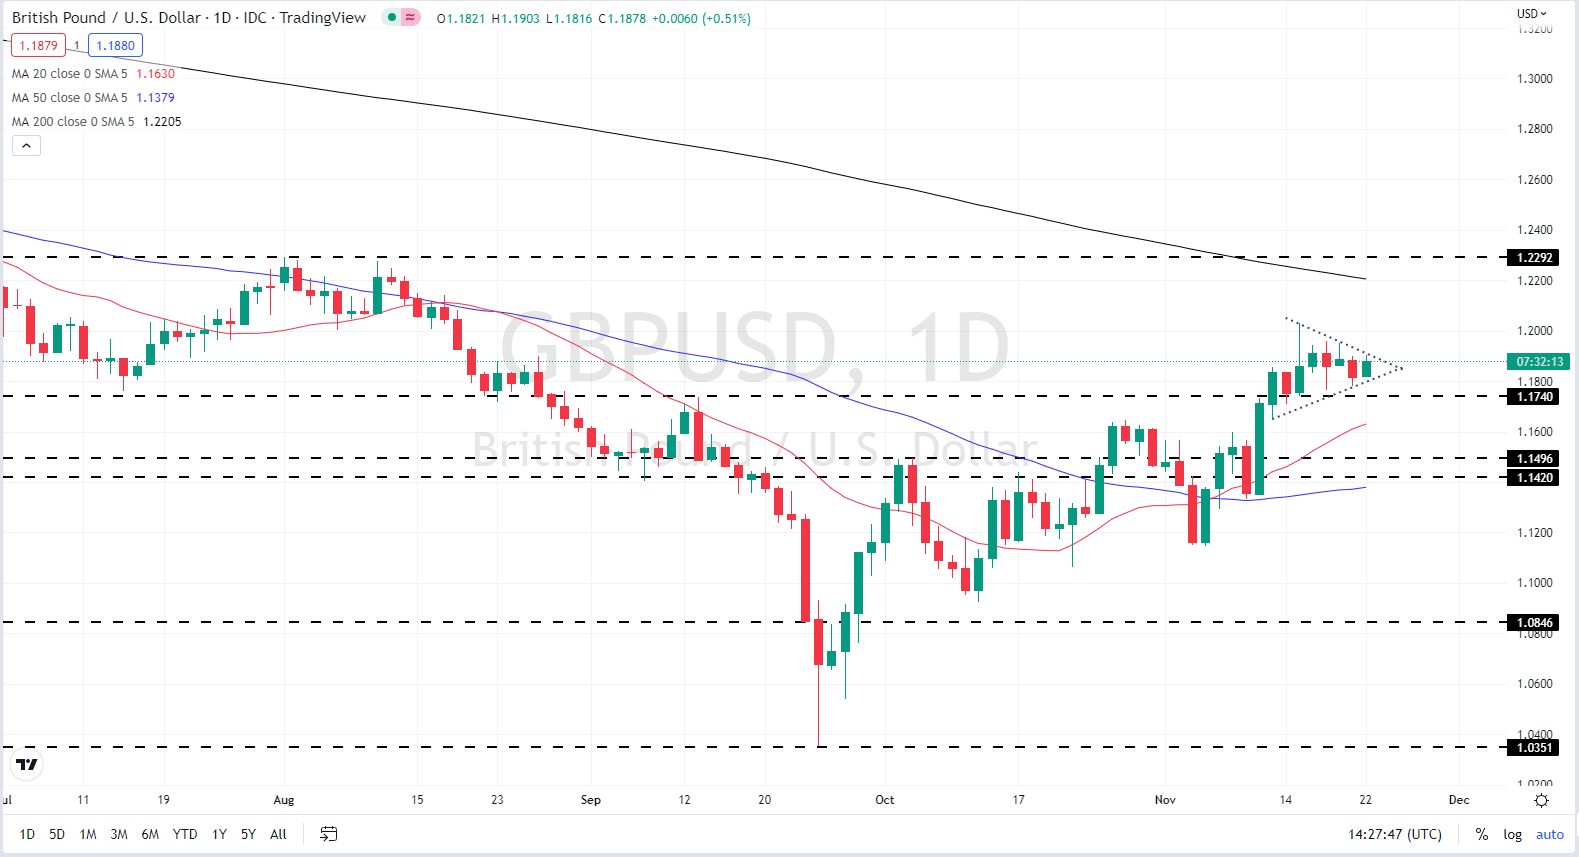
Chart via TradingView
Retail Traders are Undecided
| Change in | Longs | Shorts | OI |
| Daily | 3% | -7% | -3% |
| Weekly | 4% | -10% | -5% |
Retail trader data show 47.82% of traders are net-long with the ratio of traders short to long at 1.09 to 1.The number of traders net-long is 3.31% higher than yesterday and 6.69% higher from last week, while the number of traders net-short is 2.96% lower than yesterday and 7.35% lower from last week.
We typically take a contrarian view to crowd sentiment, and the fact traders are net-short suggests GBP/USD prices may continue to rise. Yet traders are less net-short than yesterday and compared with last week. Recent changes in sentiment warn that the current GBP/USD price trend may soon reverse lower despite the fact traders remain net short.
What is your view on the British Pound – bullish or bearish?? You can let us know via the form at the end of this piece or you can contact the author via Twitter @nickcawley1.


