


POUND STERLING TALKING POINTS
- BoE divergence from ECB and Fed restricting GBP.
- Technical analysis corroborates fundamental factors.
- 200-day SMA crucial for both GBP/USD and EUR.GBP currency pairs.

GBP FUNDAMENTAL BACKDROP
The British pound remains under pressure today against both the U.S. dollar and euro respectively with the central bank differential weighing on GBP. Both the ECB and Federal Reserve have reiterated their fight against inflation with the ECB slightly more hawkish, while the Bank of England (BoE) is expected to end their monetary tightening before the rest.
The economic calendar today is focused on U.S. and EZ data with building permits set to push lower to its lowest level for 2022 and may provide cable with some upside momentum. With regards to the eurozone, consumer confidence is forecasted at improving from the November read leaving the door open for additional euro strength should the actual data come in line or exceed expectations.
Trade Smarter - Sign up for the DailyFX Newsletter
Receive timely and compelling market commentary from the DailyFX team
ECONOMIC CALENDAR
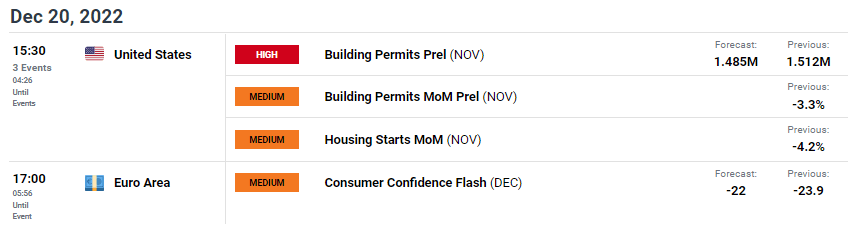
Source: DailyFX Economic Calendar
TECHNICAL ANALYSIS
Introduction to Technical Analysis
Candlestick Patterns
Recommended by Warren Venketas
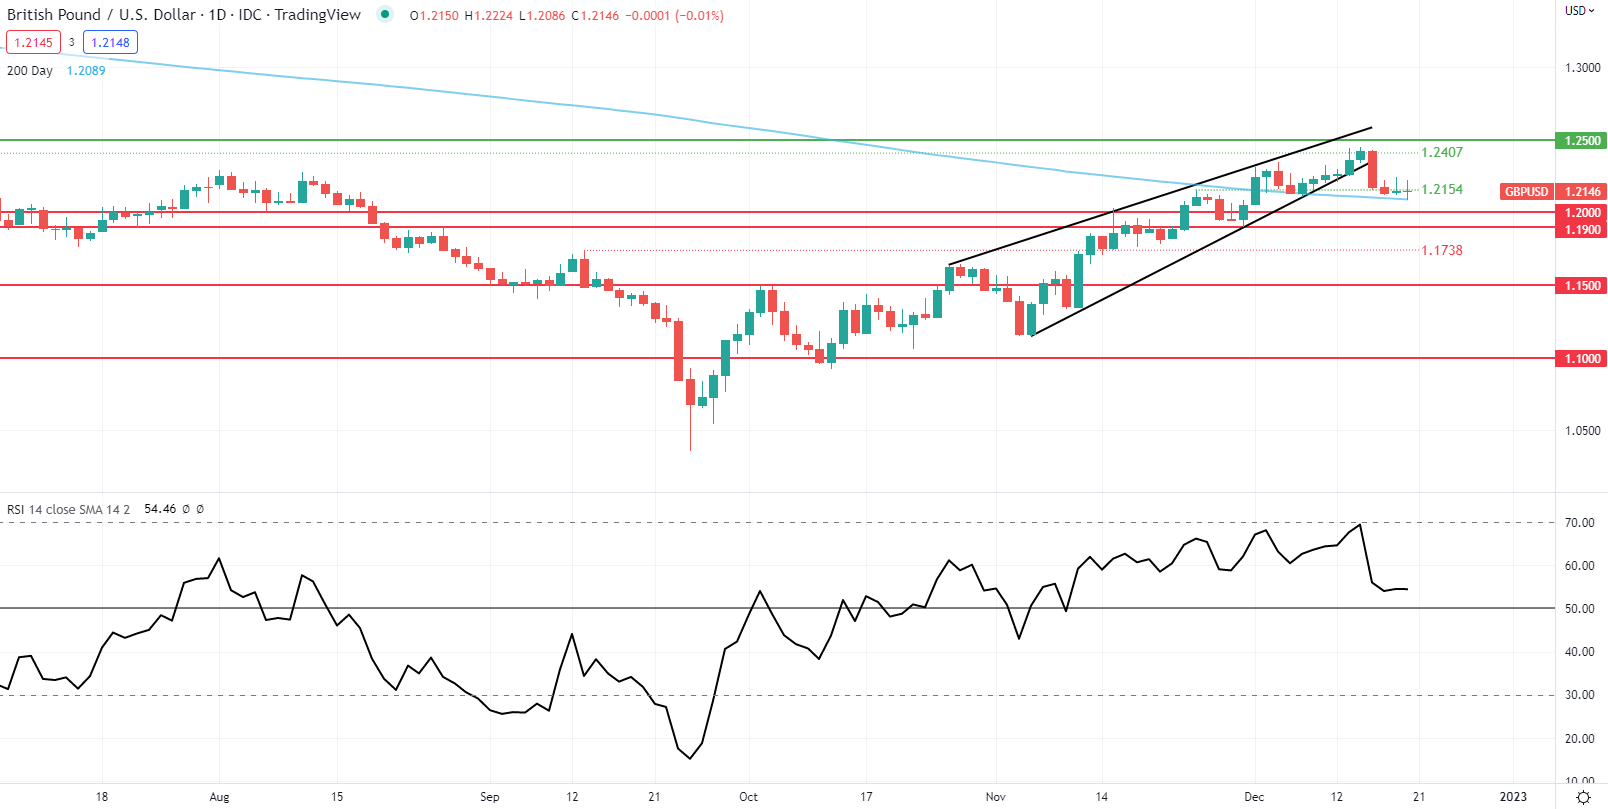
Chart prepared by Warren Venketas, IG
The daily cable chart above which has recently broken below the rising wedge chart pattern (black) now finds itself testing the key 200-day SMA (blue) support zone. A confirmed break below this are of confluence could expose the 1.2000 psychological handle once more. From a momentum point of view, the Relative Strength Index (RSI) has come off overbought levels and approaches the RSI midpoint leaving room for additional downside should the oscillator move into the bearish area (below 50).
Key resistance levels:
- 1.2407
- 1.2154
Key support levels:
- 200-day SMA
- 1.2000
- 1.1900
BEARISH IG CLIENT SENTIMENT
IG Client Sentiment Data (IGCS) shows retail traders are currently EVENLY SPLIT on GBP/USD, with 50% of traders currently holding short positions (as of this writing). At DailyFX we typically take a contrarian view to crowd sentiment but due to recent changes in long and short positioning, we settle on a short-term downside bias.
EUR/GBP DAILY CHART
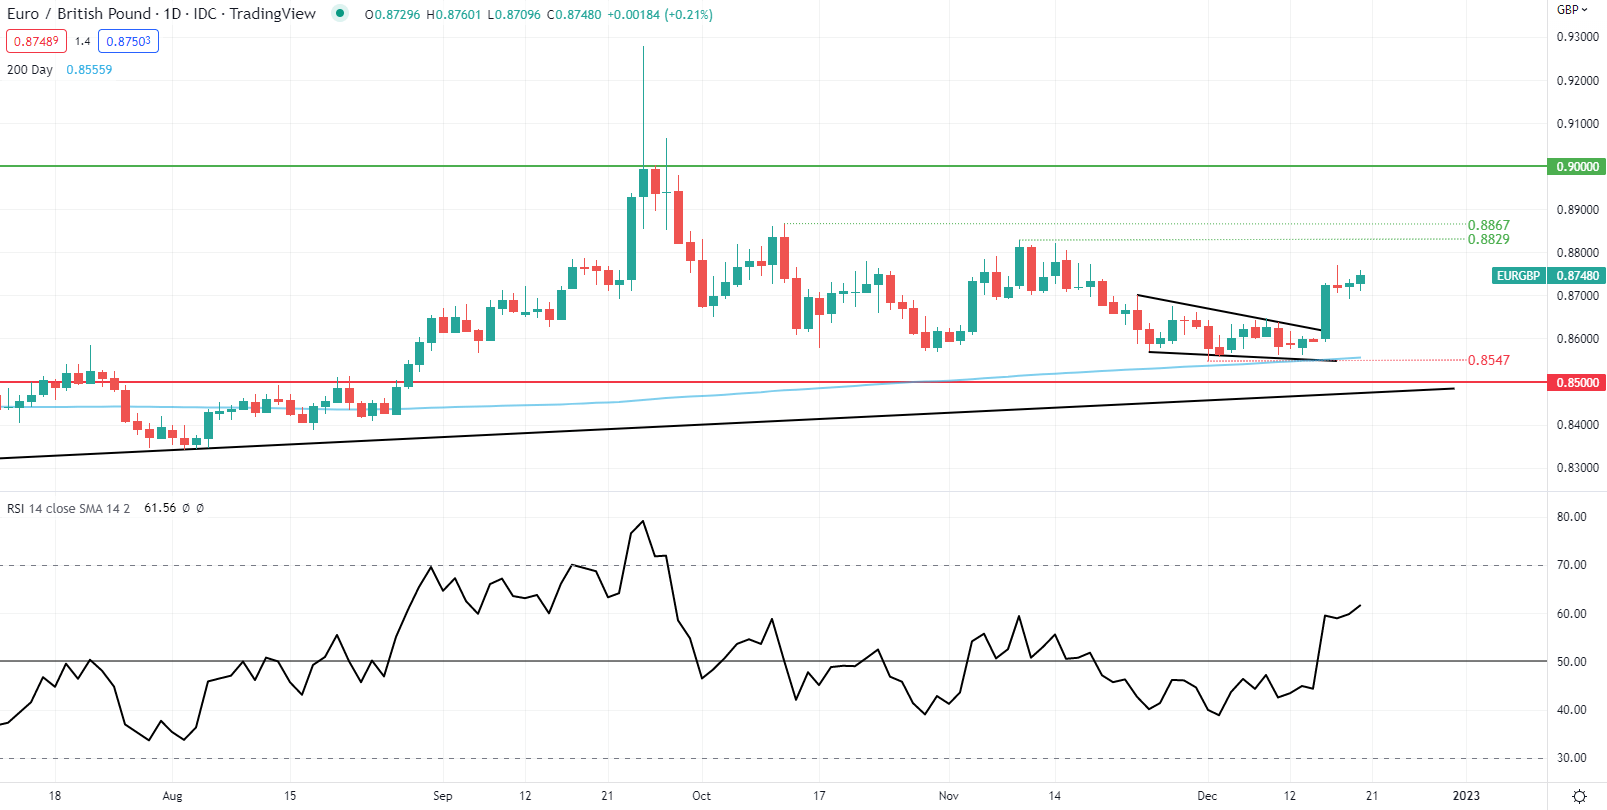
Chart prepared by Warren Venketas, IG
EUR/GBP has respected the 200-day SMA (blue), pushing off this support zone and consequently breaking through the falling wedge support (black). With the RSI far off overbought levels, there is scope for subsequent upside towards the 0.8800 resistance handle and beyond.
Key resistance levels:
- 0.8867
- 0.8829
- 0.8800
Key support levels:
- 0.8700
- 200-day SMA/0.8547
BULLISH IG CLIENT SENTIMENT
IG Client Sentiment Data (IGCS) shows retail traders are currently SHORT on EUR/GBP, with 56% of traders currently holding short positions (as of this writing). At DailyFX we typically take a contrarian view to crowd sentiment resulting in a short-term upside bias.
Contact and followWarrenon Twitter:@WVenketas


