


EUR/USD Treading on Thin Ice, Breakdown Possible
The weekly chart below illustrates that following a prolonged period of weakness over the past few months, EUR/USD has descended towards the 1.0600 threshold. This critical support zone is defined by the March 2020 lows and aligns with the 38.2% Fibonacci retracement of the advance from September 2022 to July 2023, so it has strong significance from a technical perspective.
Although the 1.0600 floor has managed to hold through the end of the third quarter, it remains at risk of giving way as the bears appear to be in control of the market. In the event of a breakdown, all bets are off. This scenario could unleash strong downward pressure, setting the stage for a drop toward 1.0395. On further weakness, the focus shifts to 1.0190, the 61.8% retracement of the move discussed before.
On the flip side, if sentiment improves and turns in favor of buyers, a rebound could gain some momentum. In this scenario, initial resistance lies near the psychological 1.0900 mark. While taking out this barrier could prove challenging for the bulls, a successful breakout could reinforce upward impetus, paving the way for a rally toward the 2023 high located around 1.1275.
The central theme of this article revolves around exploring the technical outlook for the euro. For a deeper dive into the fundamental profile, grab a free copy of the Euro Q4 forecast.

EUR/USD Weekly Chart
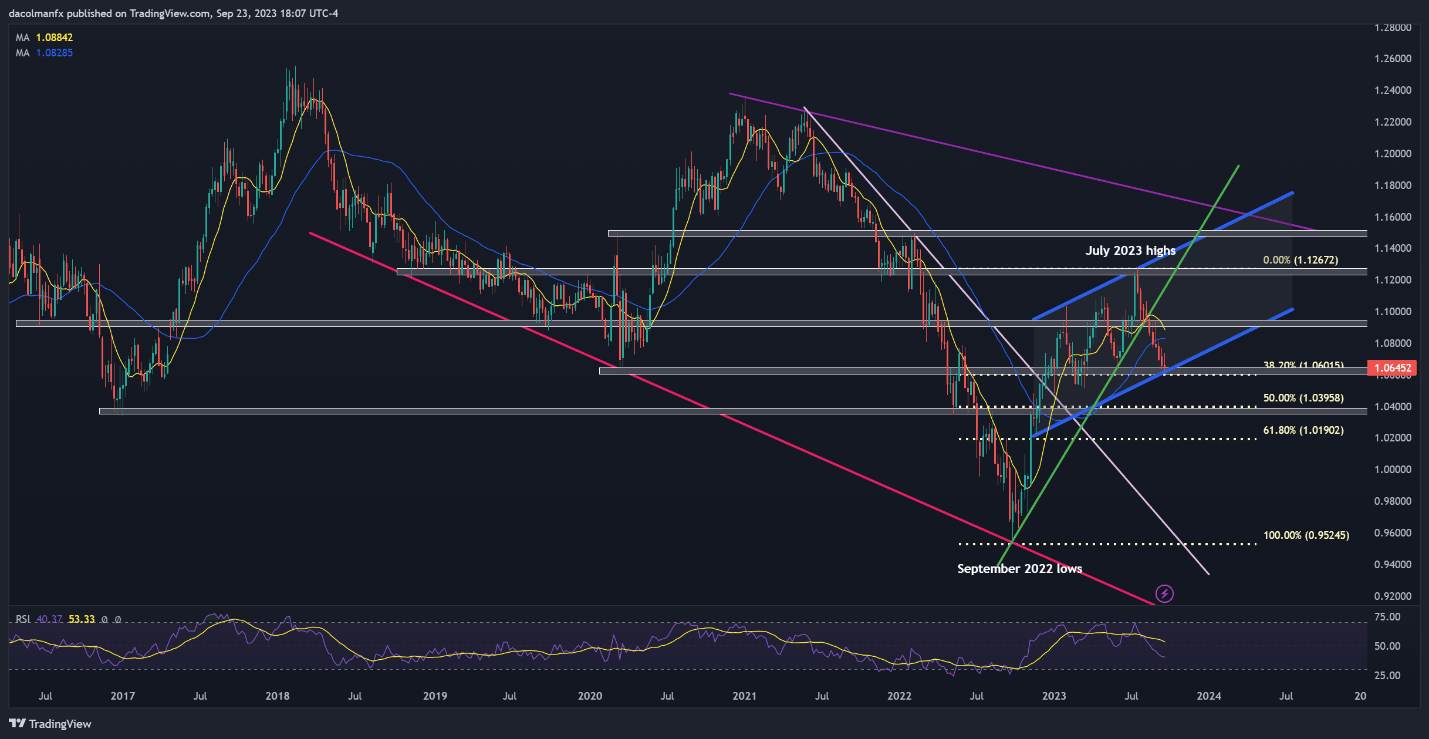
Source: TradingView, Prepared by Diego Colman
EUR/JPY Shows Emerging Signs of Vulnerability
EUR/JPY has been in a sustained uptrend since May 2020, making impeccable higher highs and higher lows during its bull run. The pair gained further impetus in March last year, rallying powerfully within the confines of an ascending channel, but prices began to stall this quarter when buyers failed to break above a key technical barrier located near the psychological 160.00 area, as shown on the weekly chart below.
To see a robust resurgence in upward momentum, the bullish camp will have to drive the exchange rate decisively above channel resistance at 160.00. Upside clearance of this ceiling has the potential to draw fresh buyers into the market, paving the way for an ascent towards 161.25. On further strength, attention shift towards 164.00, followed by 170.00, an important area aligning with the highs from 2007 and 2008.
Conversely, if sellers regain the upper hand and spark a firm rejection of the 160.00 handle, the first line of support is positioned at 153.40, and 151.50 thereafter. In the event of a breakout, the bears could become emboldened to initiate an attack on 148.50, followed by 145.60, the latter level corresponding to the lower limit of an ascending channel that has been in place for about 19 months.
Explore the influence of crowd mentality in FX markets. Download our sentiment guide to gain insights into how EUR/JPY’s positioning may impact the exchange rate’s direction.
| Change in | Longs | Shorts | OI |
| Daily | -1% | 0% | 0% |
| Weekly | -25% | -2% | -6% |
EUR/JPY Weekly Chart
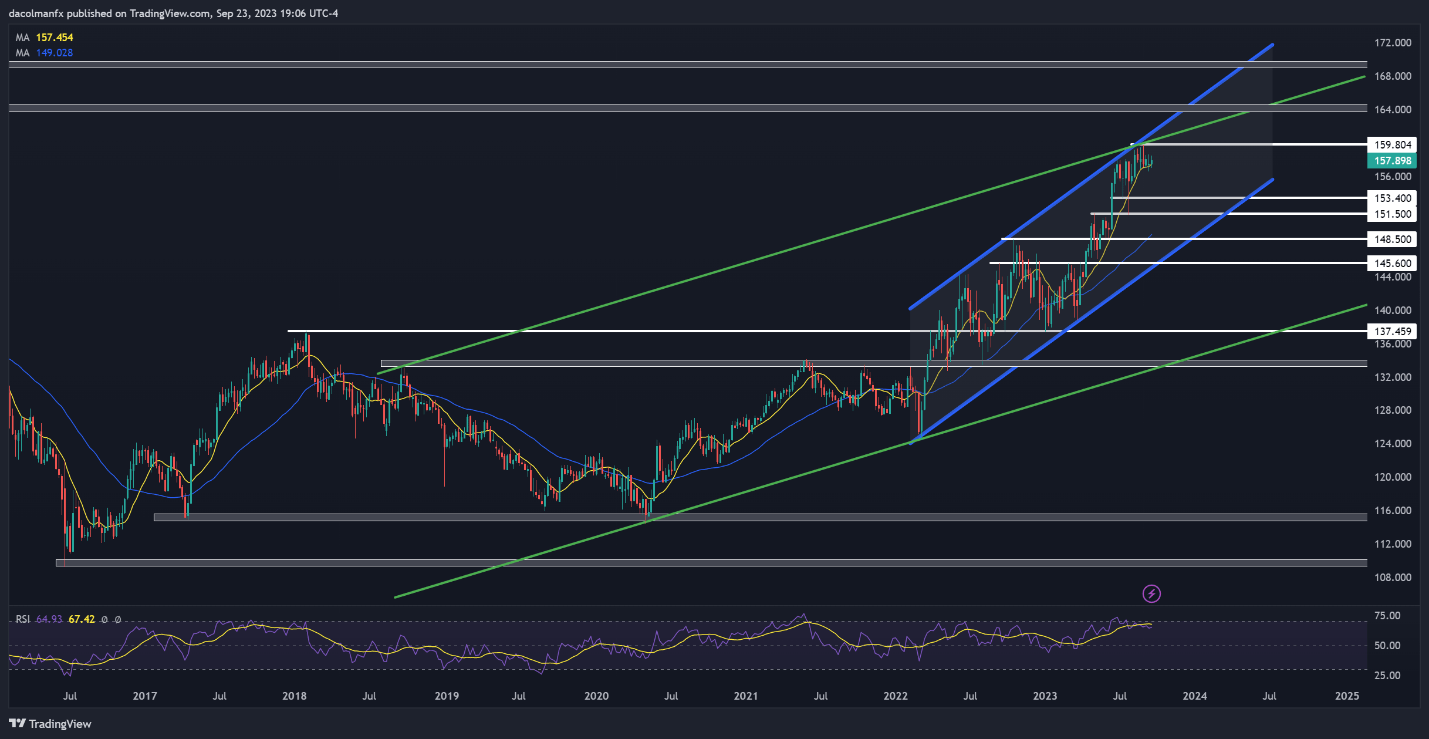
Source: TradingView, Prepared by Diego Colman
EUR/GBP At Critical Juncture
EUR/GBP plunged to fresh 2023 lows in August, but eventually found support around the 0.8500 level, at which point it began a process of bottoming out. Shortly thereafter, the pair staged a moderate rebound, rallying toward cluster resistance at 0.8700 in late September, near an area where two key trendlines align with the 200-day simple moving average and multiple swing highs of recent years.
It remains uncertain whether buyers will have the ability to decisively propel prices above the 0.8700 handle heading into the fourth quarter. However, in the event of a sustained breakout, the possibility of a move toward 0.8800 cannot be dismissed. This represents a key technical barrier, being the 38.2% Fib retracement of the Sept 2022/Aug 2023 pullback. On further strength, the crosshairs will be set on 0.8892.
In contrast, if market sentiment shifts in favor of sellers and prices get rejected from confluence resistance at 0.8700, bearish pressure could gather pace, paving the way for a drop toward the psychological 0.8600 market. While prices may find a foothold in this area on a pullback, a breach beneath this floor could reinforce the downward pressure, leading to a descent towards 0.8525. Further down the line, support is seen at the 2023 lows, followed by 0.8340.
Looking for actionable trading ideas? Download our top trading opportunities guide packed with insightful strategies for the fourth quarter!

EUR/GBP Weekly Chart
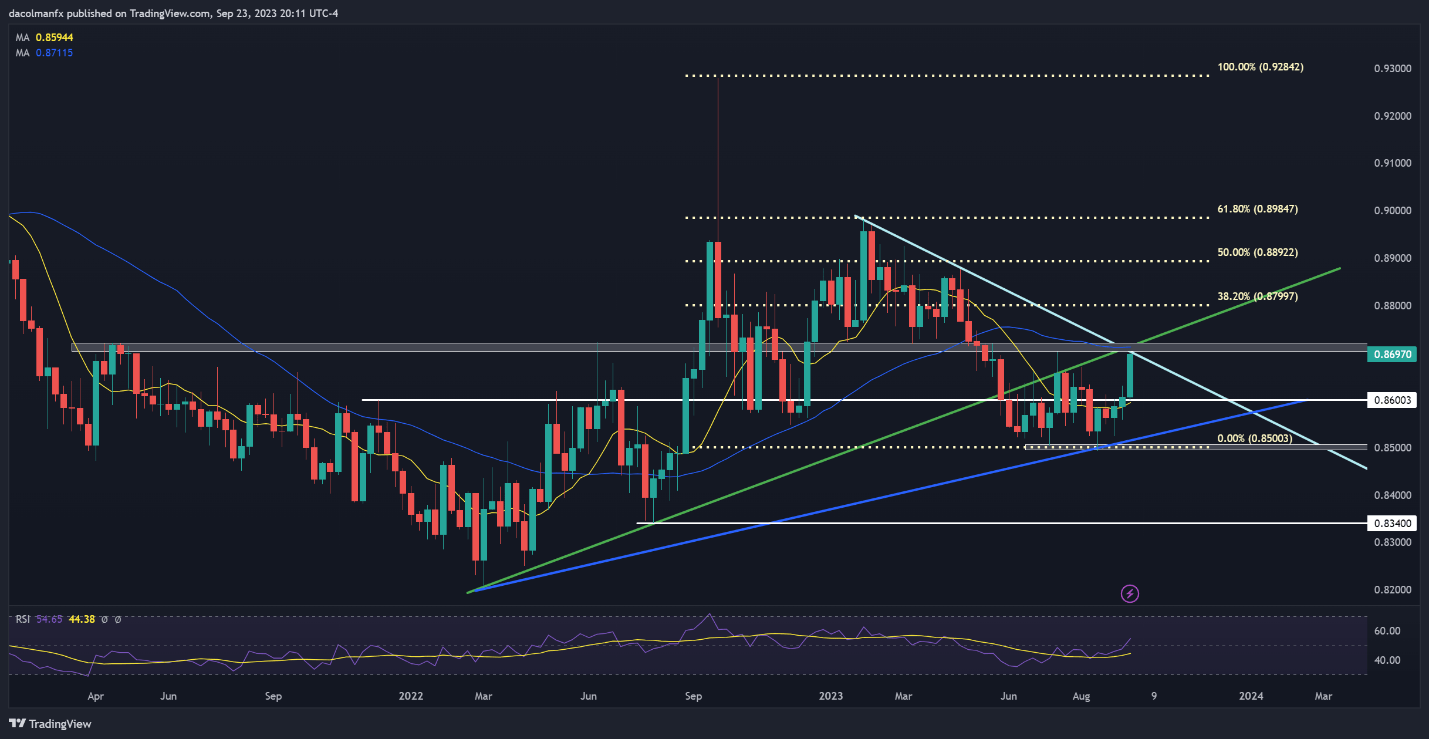
Source: TradingView, prepared by Diego Colman


