


EUR/USD AND GBP/USD FORECAST:
- EUR/USD pivots lower and resumes its decline after failing to break above a key technical resistance area
- GBP/USD appears to close to validating a double top bearish pattern
- The surge in U.S. Treasury yields is boosting volatility in the FX space, creating interesting trading setups

Most Read: US Dollar Soars Lifted by Surging Yields, S&P 500 Falls Despite VIX's Slide
The surge in U.S. Treasury yields over the past several days has fueled volatility in the FX market, creating interesting trading set-ups in multiple currency pairs, including EUR/USD, GBP/USD and USD/JPY. This article will explore attractive price action configurations that traders should keep an eye on over the coming days and weeks.
EUR/USD TECHNICAL ANALYSIS
After failing to clear resistance in the 1.0690/1.0700 area earlier this week, EUR/USD has resumed its descent, breaking down one support after another, with bearish pressure accelerating on Thursday. If sellers retain control of the market, the next technical floor to consider is located near 1.0565, followed by 1.0535. On further weakness, the focus shifts to January’s low printed at 1.0480.
On the flip side, if bulls regain the upper hand, which seems unlikely at this time given the U.S. dollar bullish momentum, initial resistance be found just above the psychological 1.0600 level. After that, the next region of interest lies at 1.0650/1.0660.
EUR/USD TECHNICAL CHART
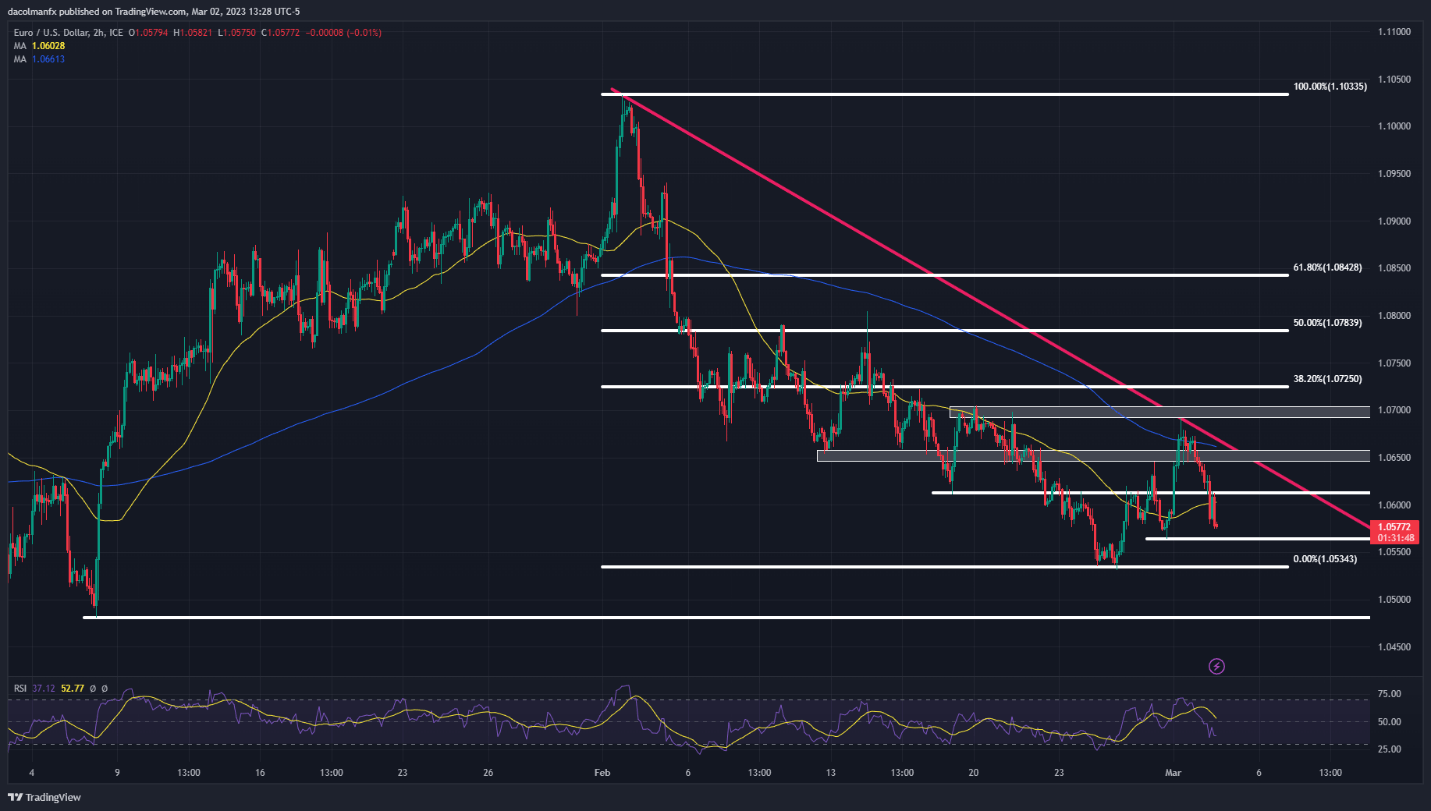
EUR/USD Technical Chart Prepared Using TradingView
Related Reading: USD/JPY Retains Bullish Outlook, Fundamentals Undermine the Japanese Yen

GBP/USD TECHNICAL ANALYSIS
Over the past several weeks, GBP/USD has been carving out a double top formation, a bearish setup composed of two peaks of similar height, divided by an intermediate depression seen as the pattern’s support. If that floor is taken out, which in the case of GBP/USD is located at 1.1920, the double top would be validated, creating the technical conditions for a pullback towards 1.1840, followed by 1.1650, the 38.2% Fibonacci retracement of the September 2022/January 2023 advance.
On the other hand, if buyers defend the price zone of 1.1920 and spark a bullish comeback, initial resistance lies at 1.1990 and 1.2090 thereafter. Above that, the pattern’s two crests near 1.2150 will come into play.
GBP/USD TECHNICAL CHART
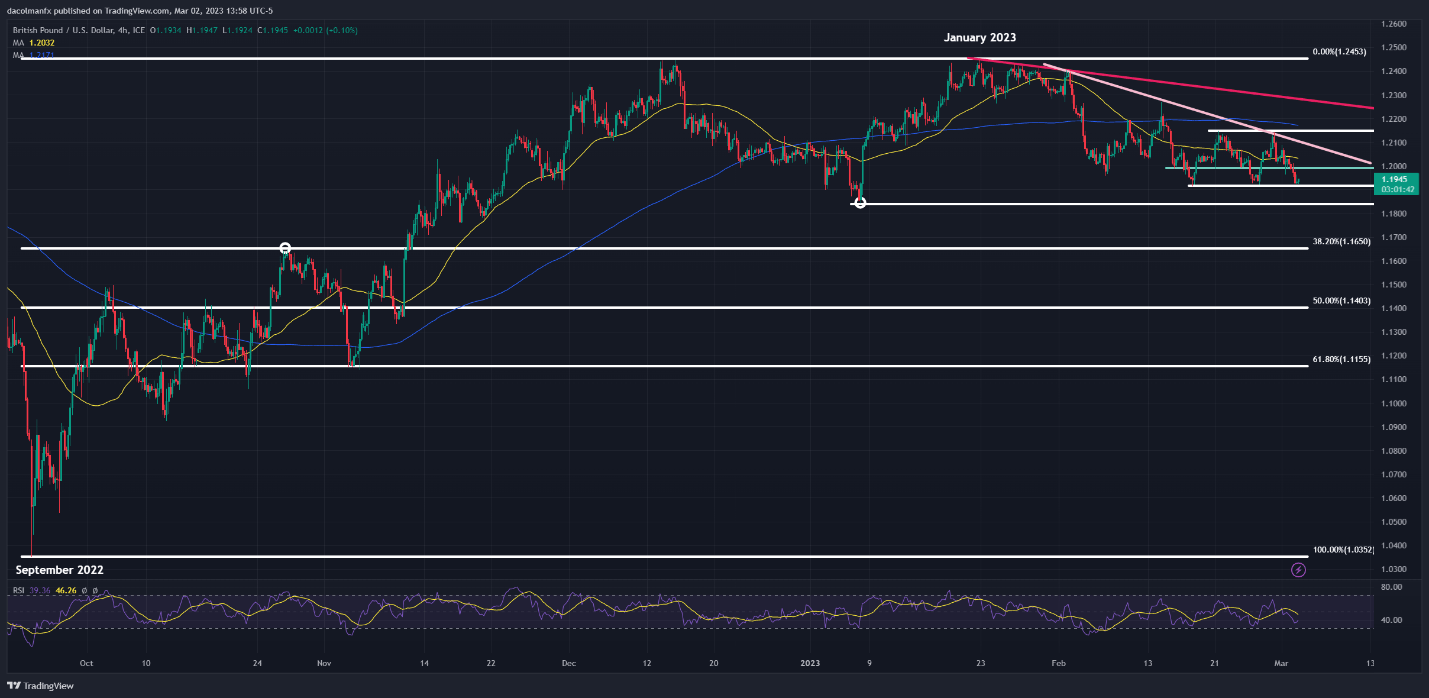
GBP/USD Chart Created Using TradingView
Written by Diego Colman, Contributing Strategist for DailyFX


