


AUD/USD ANALYSIS & TALKING POINTS
- Better than expected capital expenditure indicates positivity in building, plant machinery and private capital sectors.
- U.S. GDP in focus later today.
- AUD/USD seeking falling wedge breakout.

AUSTRALIAN DOLLAR FUNDAMENTAL BACKDROP
The Australian dollar has clawed back some lost gains after yesterday’s U.S. dollar surge post-FOMC minutes. An almost expected hawkish slant to the minutes ensued with no mention of disinflation adding to a sustained tight monetary policy environment. Furthermore, some FOMC members opted for a 50bps interest rate hike which has seen an uptick in money market pricing for the March meeting (+/- 30bps at present).
Trade Smarter - Sign up for the DailyFX Newsletter
Receive timely and compelling market commentary from the DailyFX team
Australian capital expenditure data beat estimates across the board (reaching its highest level since Q4 2021) showing optimism in these sectors and the increase in capital inflows has driven up the demand for the AUD this morning. Looking ahead, markets will be focused on US GDP as well as the accompanying labor market data in the form of jobless claims. US GDP is expected to come in marginally weaker than the previous read while we look to roundoff the trading day with the Fed’s Bostic for further guidance.
ECONOMIC CALENDAR
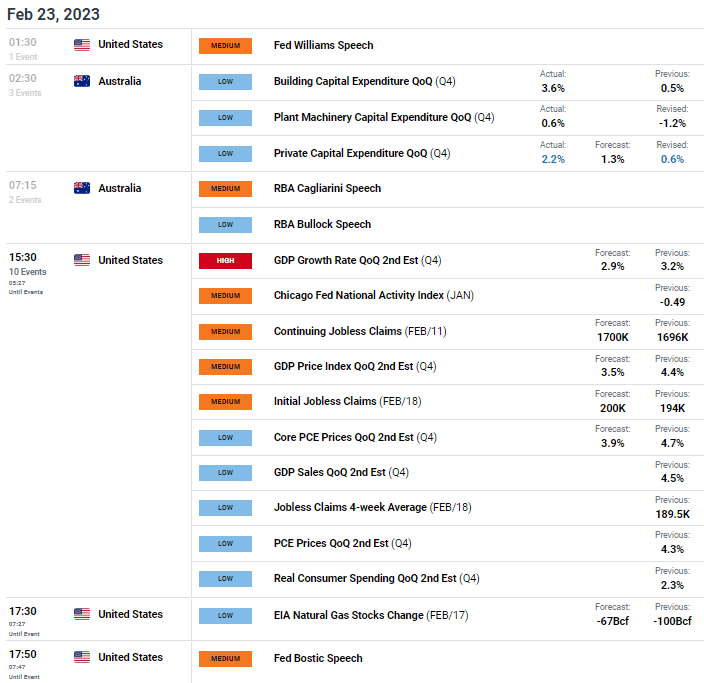
Source: DailyFX economic calendar
TECHNICAL ANALYSIS
Introduction to Technical Analysis
Candlestick Patterns
Recommended by Warren Venketas
AUD/USD DAILY CHART
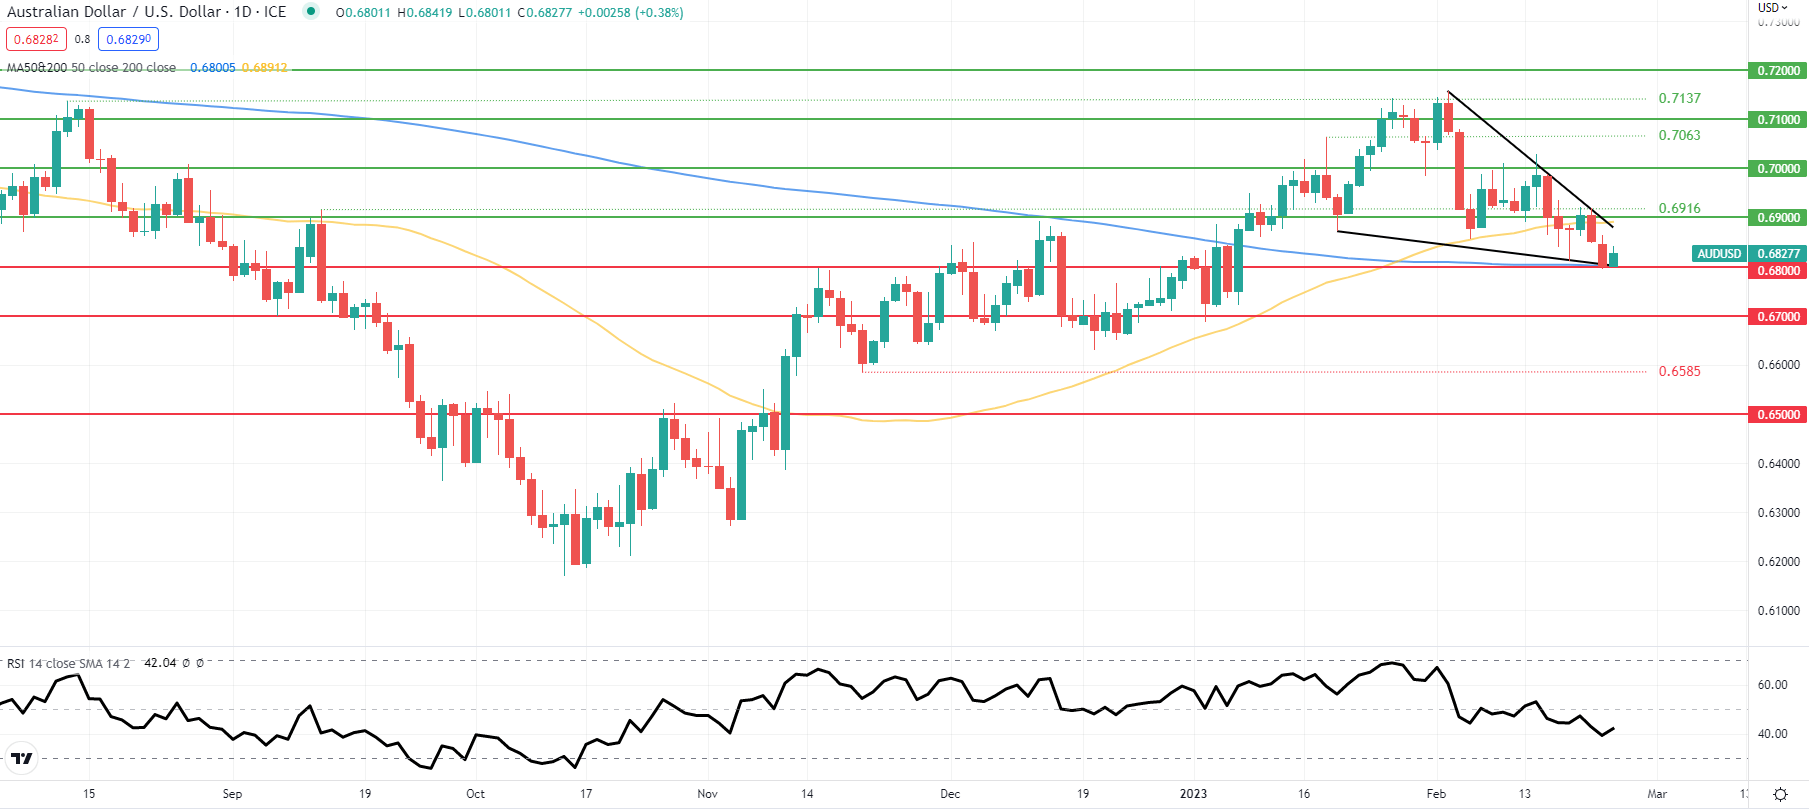
Chart prepared by Warren Venketas, IG
Daily AUD/USD price action extends its move withing the falling wedge chart pattern (black) that traditionally points to an upside breakout. The 0.6800 psychological support handle has been defended by bulls in conjunction with the 200-day SMA (blue) but a daily candle close below this key inflection point could invalidate the falling wedge. From a bullish perspective, a breach above wedge resistance/50-day SMA/0.6900 could then see a follow through towards subsequent resistance zones.
Key resistance levels:
- 0.7000
- 0.6916
- 0.6900/Wedge resistance/50-day SMA
Key support levels:
- 0.6800/Wedge support/200-day SMA
- 0.6700
IG CLIENT SENTIMENT DATA: BEARISH
IGCS shows retail traders are currently LONG on AUD/USD, with 64% of traders currently holding long positions. At DailyFX we typically take a contrarian view to crowd sentiment resulting in a short-term bearish disposition.
Contact and followWarrenon Twitter:@WVenketas


