
EUR/USD and EUR/GBP Prices, Charts, and Analysis

Fed Making Headway as US Inflation Slows, S&P 500 Edges Higher
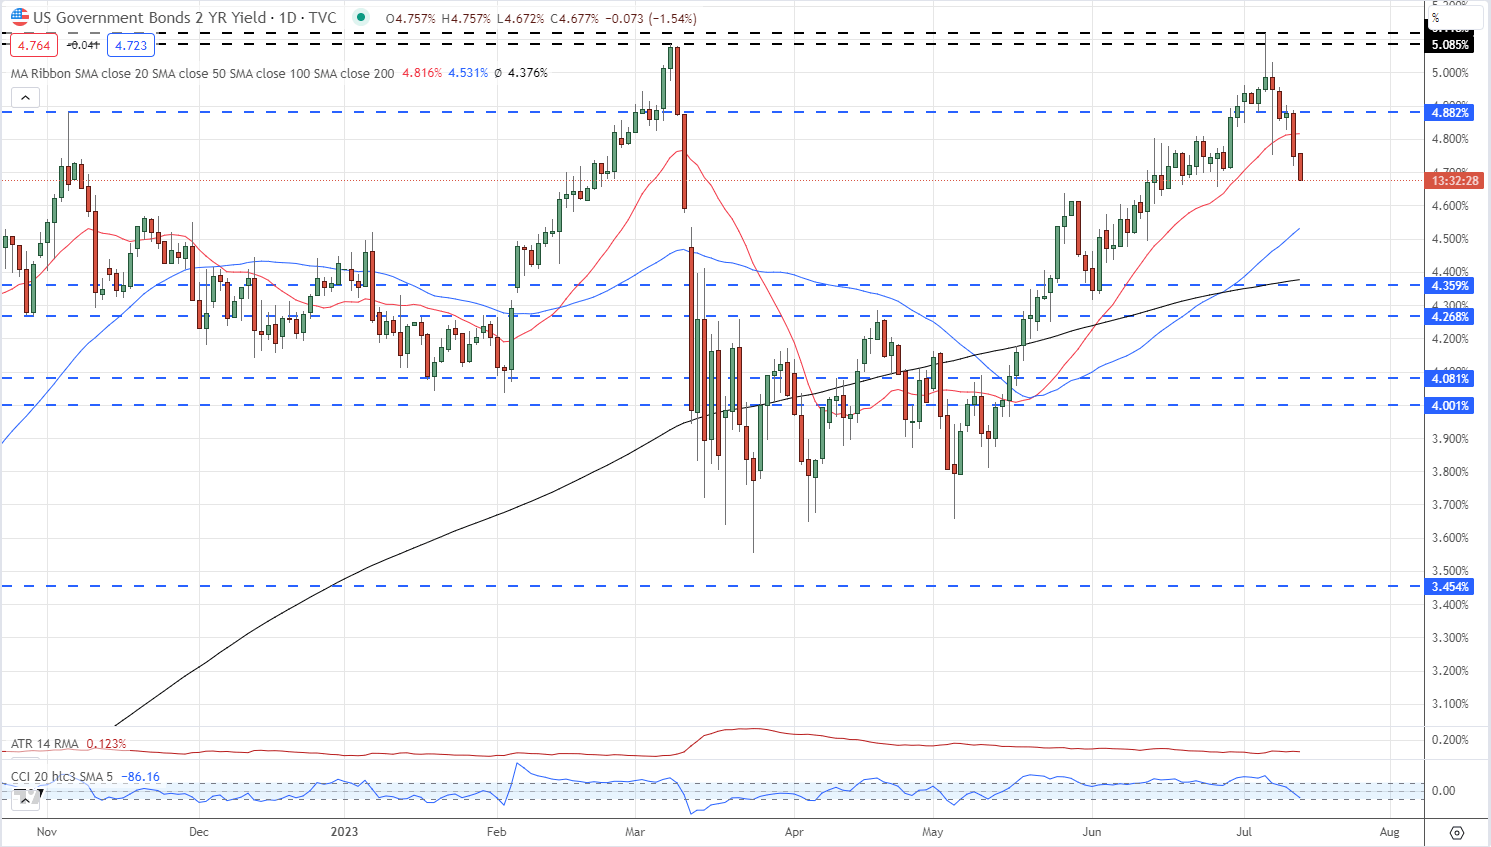
The latest US inflation report showed price pressures easing by more than anticipated, a much-needed boost for the Federal Reserve as they continue to tackle inflation. Yesterday’s release sent US Treasury yields tumbling further as traders continue to price in a potential ’one and done’ on US rate hikes. The Fed is fully expected to hike rates by 25 basis points later this month, but with inflation easing, they may have more room to leave rates unchanged in the months ahead. The recent sell-off in bond yields and US dollar weakness support the peak rate idea. The rate-sensitive two-year UST has shed 40 basis points in the last week.
US Treasury Two-Year Yields
For all market-moving events and economic data releases, see the real-time DailyFX Calendar
This US dollar weakness can be seen clearly against the Euro with EUR/USD now back at highs seen around 15 months ago. Prior resistance highs made in mid-April to early May were broken in one daily candle yesterday, and if the pair consolidate above 1.1096 then these old levels of resistance may turn into levels of support. The CCI indicator at the bottom of the chart shows the pair as heavily overbought, so this needs to be normalized before EUR/USD can push further ahead. The next level of resistance is close by at 1.1185 after which 1.1250 comes into consideration.
EUR/USD Daily Price Chart – July 13, 2023
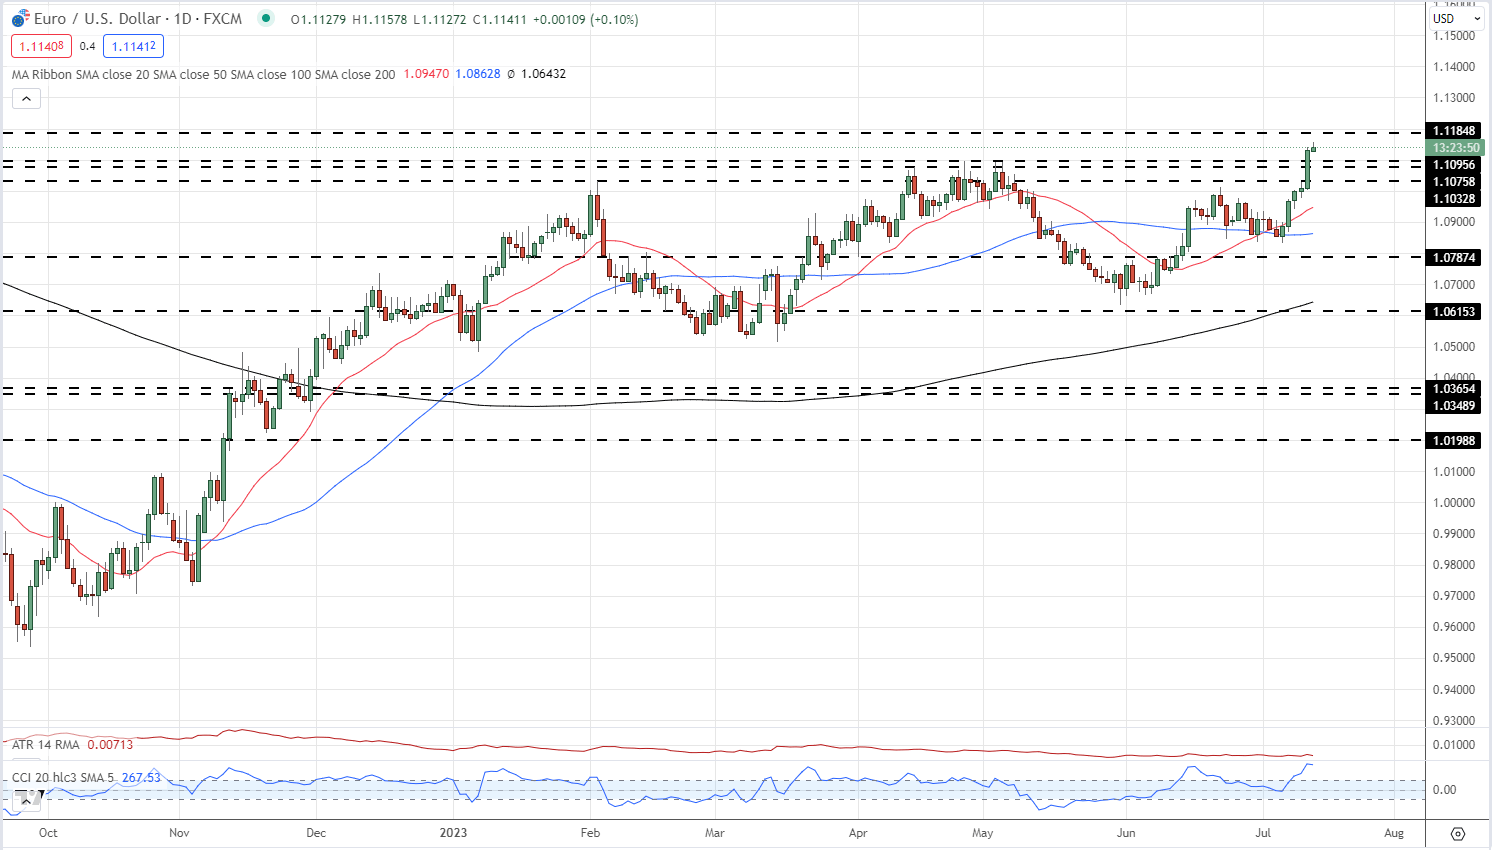
Chart via TradingView
| Change in | Longs | Shorts | OI |
| Daily | -16% | 11% | -2% |
| Weekly | -12% | 10% | -1% |
UK Economy Shrinks Less Than Expected in May, GBP/USD Breaches 1.3000
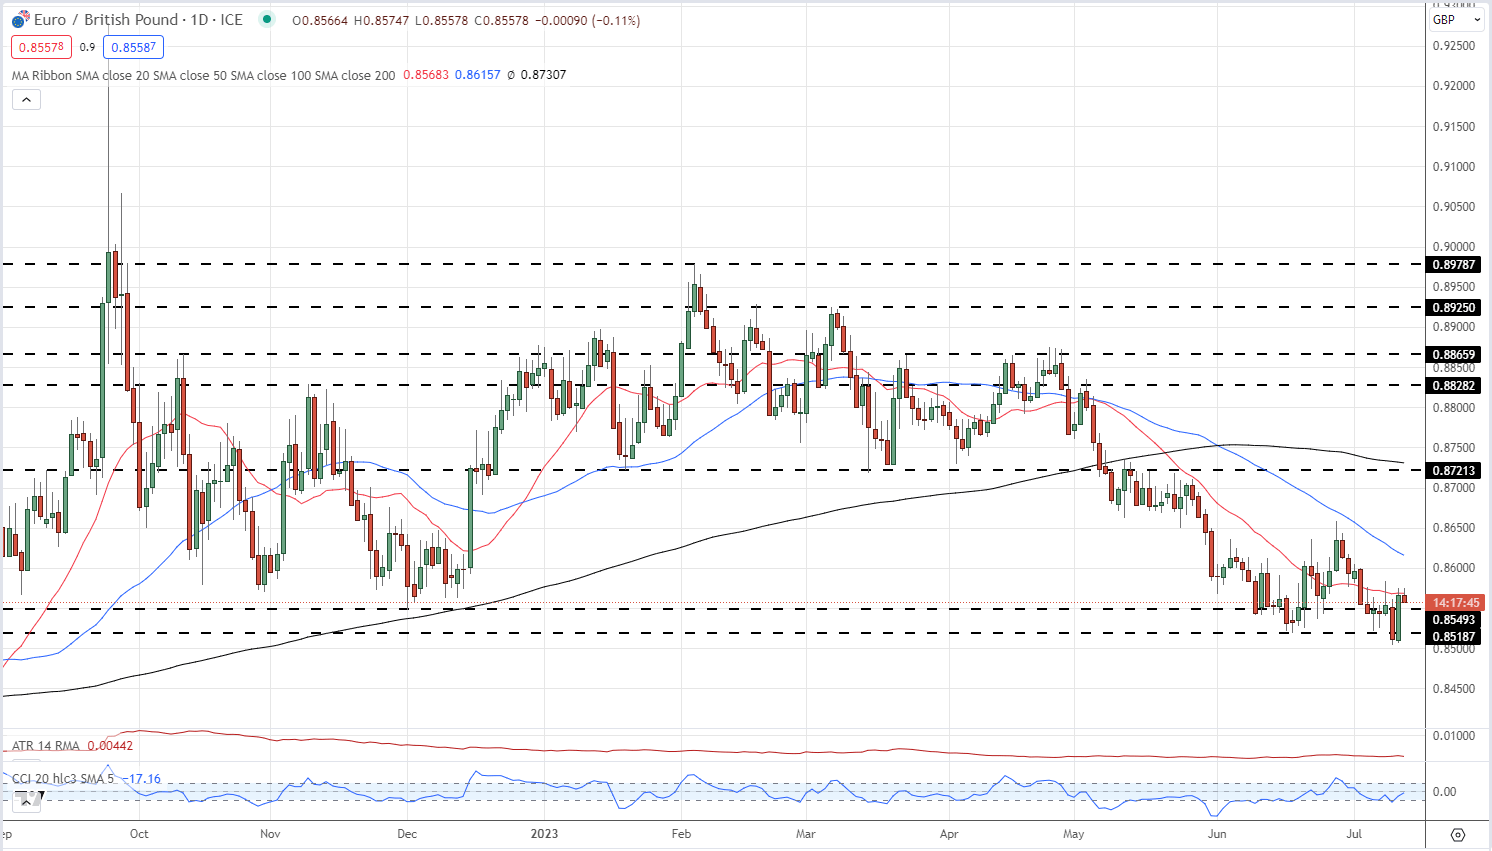
EUR/GBP is a different story with the pair continuing to drift lower. EUR/USD printed a 0.8979 multi-month high at the start of February and since then the pair have moved lower, making an unbroken series of lower highs and lower lows. Sterling remains supported by elevated bond yields and expectations that the Bank of England will continue hiking rates ever higher. The wider the interest differential becomes between the British Pound and the Euro, the lower EUR/GBP will go.
EUR/GBP Daily Price Chart – July 13, 2023
What is your view on the EURO – bullish or bearish?? You can let us know via the form at the end of this piece or you can contact the author via Twitter @nickcawley1.