Article written by IG Chief Market Analyst Chris Beauchamp
Dow Jones, Nasdaq 100, CAC 40 Analysis and Charts
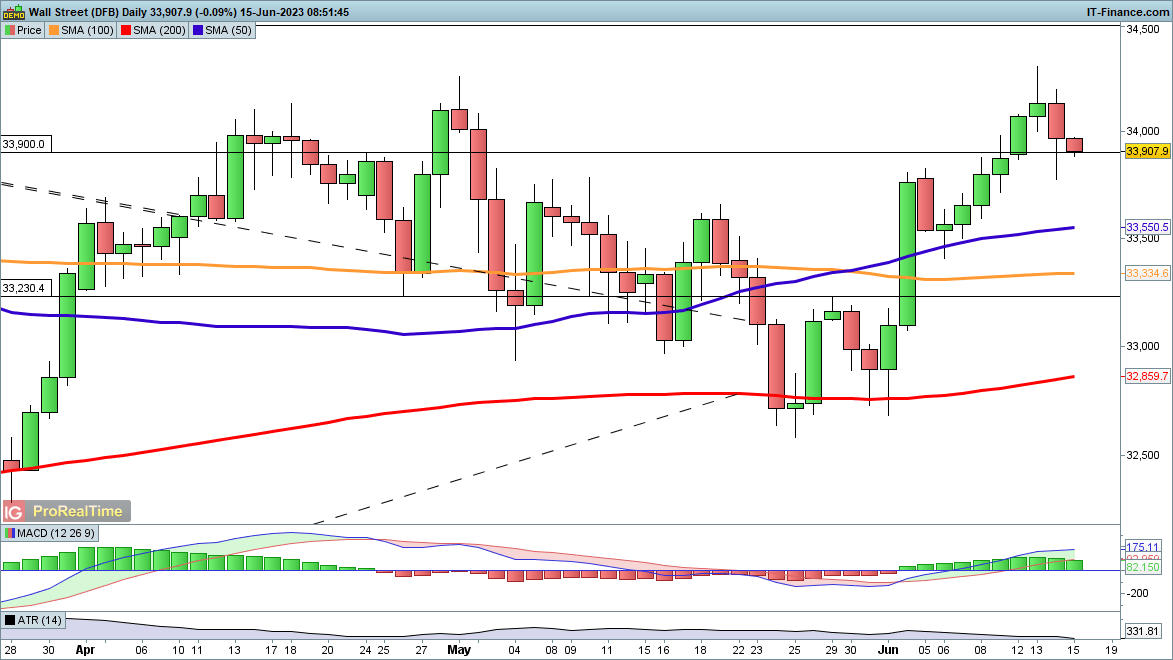
Dow pulls back from weekly high
The Fed meeting saw the index retreat from the highs hit earlier in the week. An initial bounce after the decision has faded, and a further retracement is in play.
This puts the rally from the May lows under pressure, though some consolidation is not surprising. Some further weakness towards 33,600 might not be surprising, but a move below this level might suggest the bullish move has run its course for now. A recovery above 34,000 might signal that a new move higher begins, targeting 34,200 and then higher.
Dow Jones Daily Price Chart - June 15, 2023

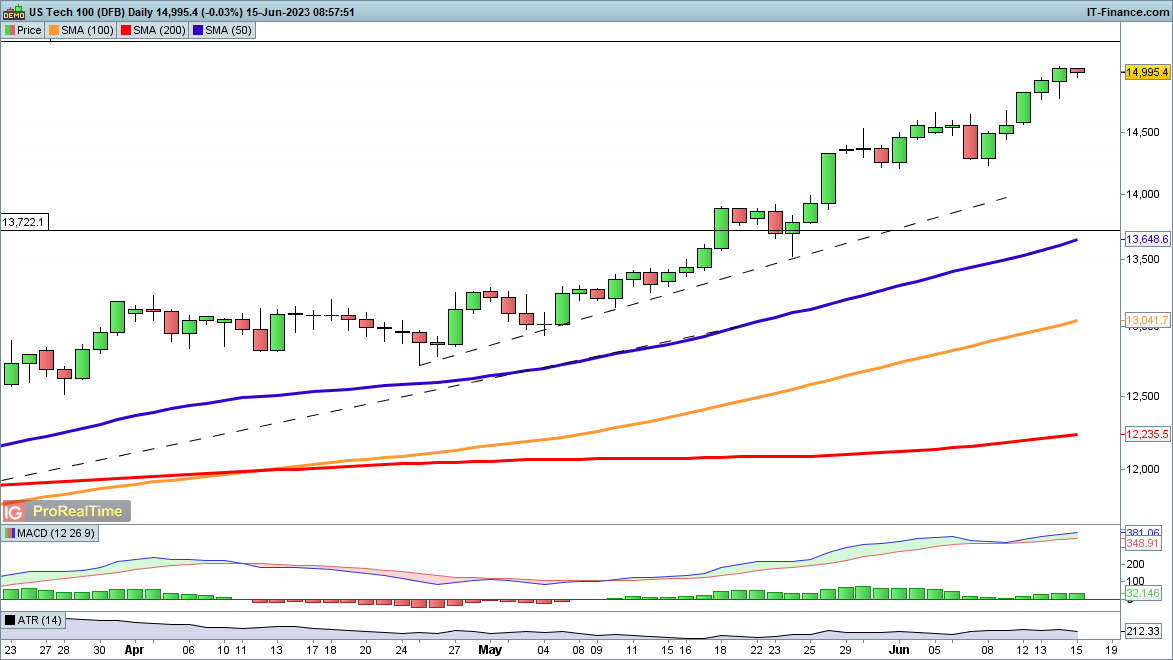
Nasdaq 100 rebounds after Fed
The index weakened slightly following the Fed decision and then rebounded.It now sits at the one-year-plus high set yesterday and leaves the uptrend firmly intact. It would need a move back below 14,500 to suggest some more sustainable short-term weakness was in play.
Further upside would result in a fresh push towards 15,259, the March 2022 peak.
Nasdaq 100 Daily Price Chart - June 15, 2023
Trade Smarter - Sign up for the DailyFX Newsletter
Receive timely and compelling market commentary from the DailyFX team
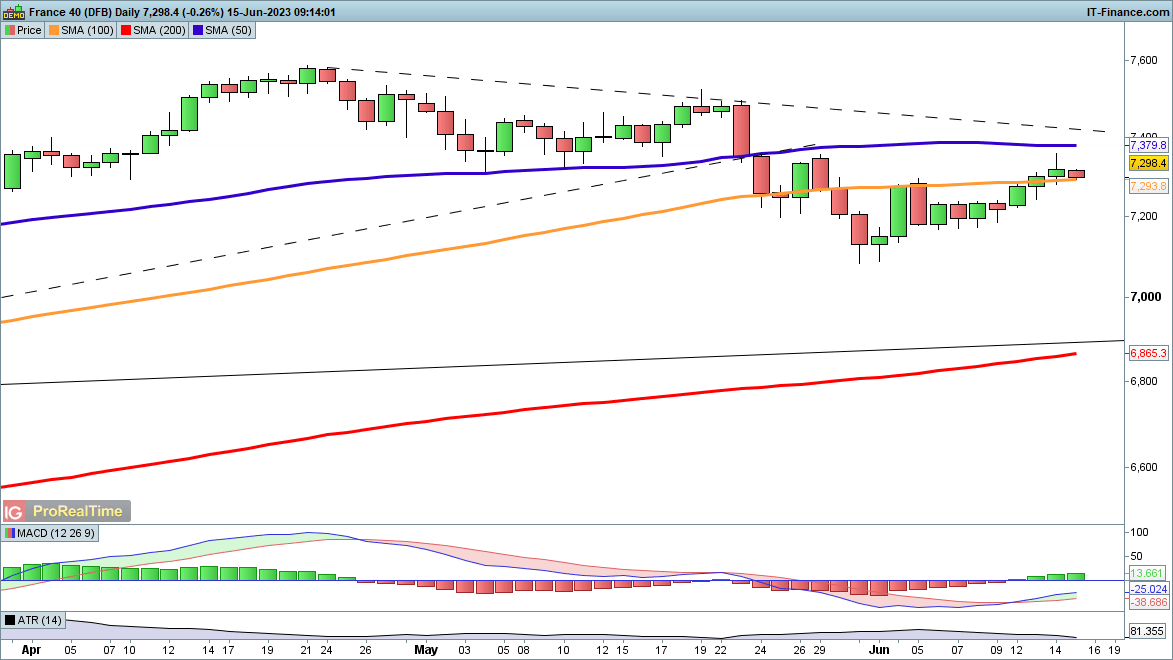
CAC40 wobbles ahead of ECB decision
Pre-ECB nerves and post-FOMC weakness has seen this index drop back from last night’s highs, though it is holding above the 100-day SMA for now.
A revival targets the 50-day SMA once again, and from there the price targets trendline resistance from the April highs. Beyond this, the May high at around 7500 and then the April high at 7584 are the next targets. A reversal below 7200 might signal that a new push to 7100 and lower is developing.
CAC 40 Daily Price Chart - June 15, 2023