


BRENT CRUDE OIL (LCOc1) TALKING POINTS
- Downside risk outweigh tailwinds at this point.
- Key economic data in focus this week.
- Friday’s close key for short-term directional bias.

BRENT CRUDE OIL TECHNICAL FORECAST:
Brent crude oil has been facing multiple headwinds of recent including global recessionary fears stoking risk aversion coupled with lesser demand. The current Chinese economic backdrop adds to the so called ‘demand destruction’ impacting oil while a hawkish outlook from the Federal Reserve has resulted in a well-supported U.S. dollar – adding pressure on crude prices.
The upcoming economic calendar (see below) includes several U.S. centric releases which should provide some USD volatility. China issues their September manufacturing PMI data which has remained largely in contractionary territory (<50) within the last 12 months however, a print higher than August (49.4) could give crude oil a boost.
ECONOMIC CALENDAR
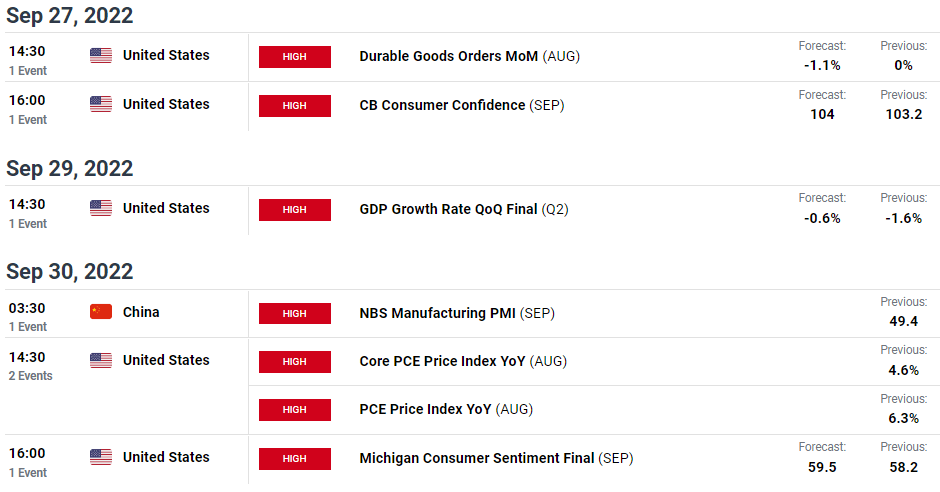
Source: DailyFX Economic Calendar
Learn more about Crude Oil Trading Strategies and Tips in our newly revamped Commodities Module!
TECHNICAL ANALYSIS
BRENT CRUDE (LCOc1) WEEKLY CHART -UNDATED
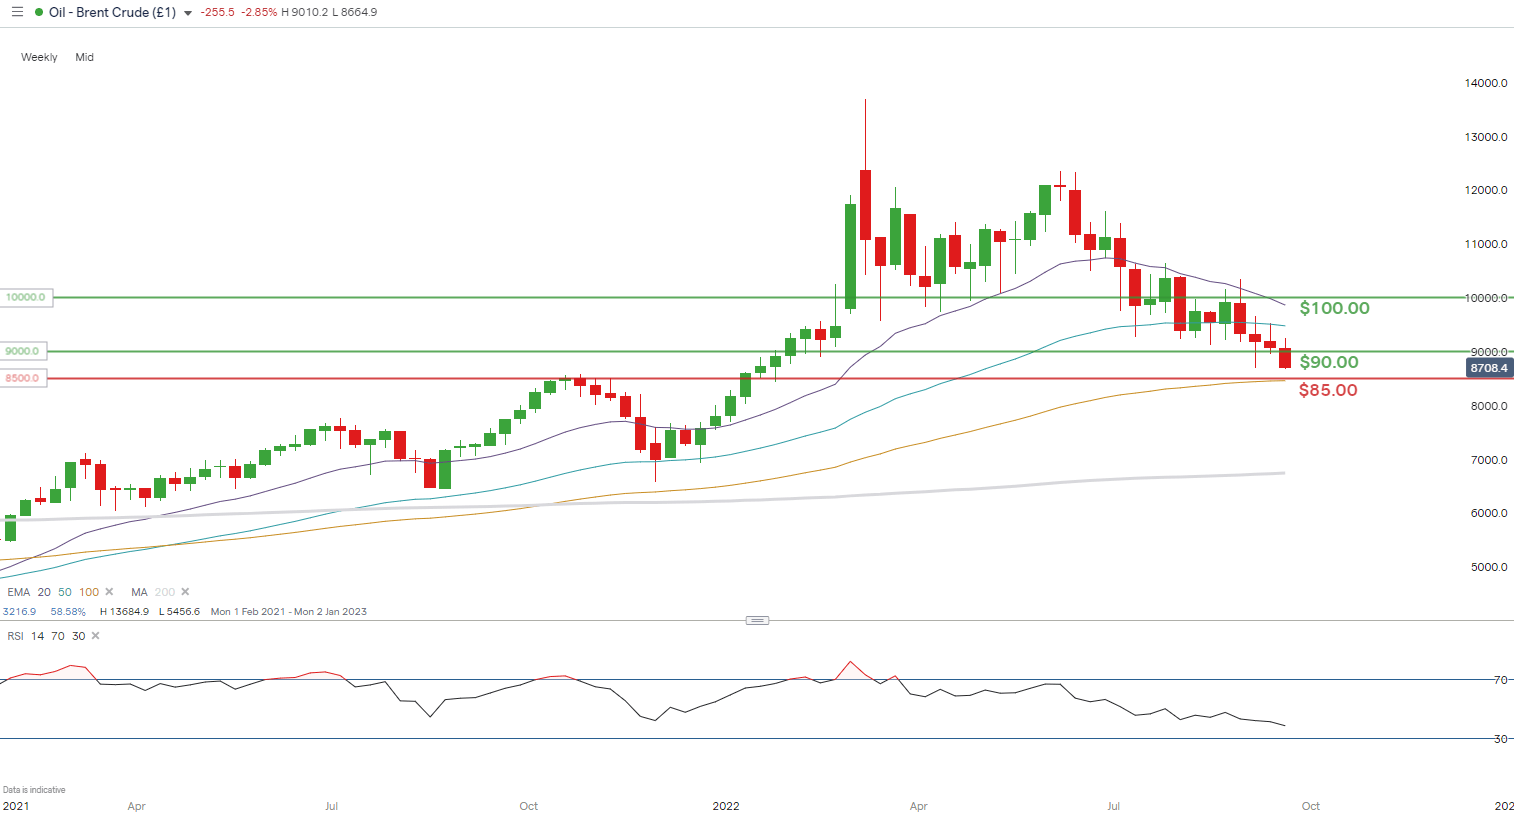
Chart prepared by Warren Venketas, IG
The long-term picture shows the steady decline in brent crude prices after the March 2022 highs and now looks to push below 85.00 hitting fresh yearly lows. This 85.00 support level coincides with the 100-day EMA (yellow) and has served as a key area of confluence for many years making a breakout that much more significant.
BRENT CRUDE (LCOc1) DAILY CHART -UNDATED
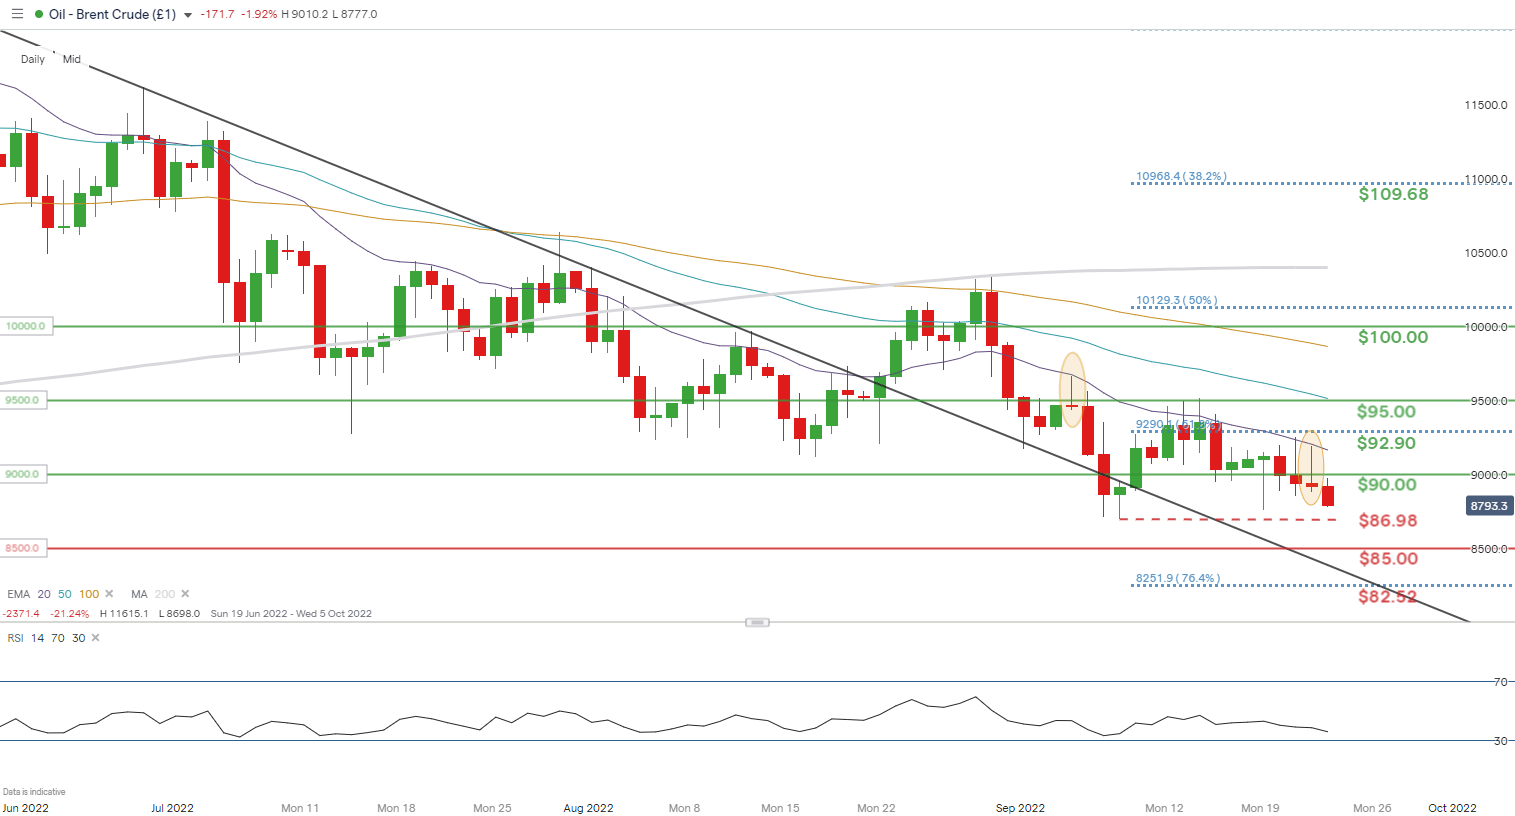
Chart prepared by Warren Venketas, IG
Price action on the daily brent crude chart shows the September swing low under pressure on Friday. A close below this level could then point to further downside towards the psychological 85.00 support zone.
Key resistance levels:
Key support levels:
- 86.98 (September swing low)
- 85.00
IG CLIENT SENTIMENT: BEARISH
IGCS shows retail traders are NET LONG on crude oil, with 78% of traders currently holding long positions (as of this writing). At DailyFX we typically take a contrarian view to crowd sentiment resulting in a short-term bearish bias.
Contact and followWarrenon Twitter:@WVenketas


