


GBP/USD - Prices, Charts, and Analysis
- Cable is higher on the week but the trading range is very narrow.
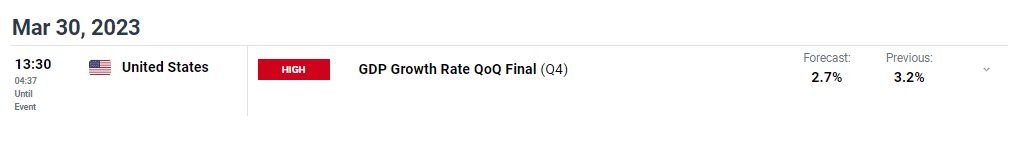
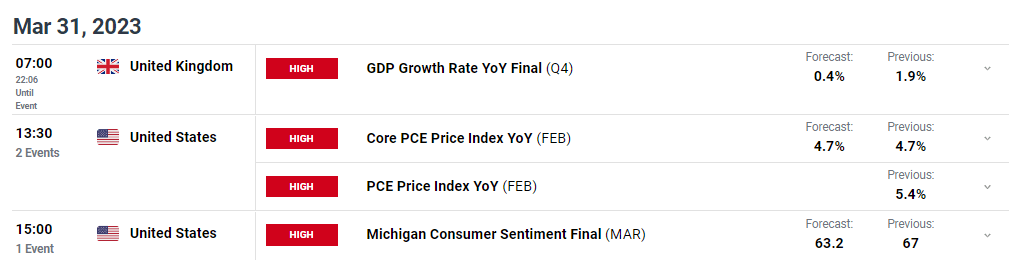
- US GDP and core PCE may add some volatility into a lackluster market.

GBP/USD traders will have found life difficult this week with the pair moving sideways to marginally higher in a tight trading range. Both the British Pound and the US dollar have had little reason to move either way with a lack of market-moving data and events so far this week weighing on price action. This is likely to change as a number of high-importance data releases hit the screens today and tomorrow.
For all market-moving data releases and events, see the DailyFX Economic Calendar
One piece of news that may boost Sterling in the longer term is expected to be announced tomorrow, according to media reports. According to The Daily Telegraph, Britain is set to join the Comprehensive and Progressive Agreement for Trans-Pacific Partnership (CPTPP) an Indo-Pacific trade group that would give UK companies access to tens of millions of new customers and a USD10 trillion marketplace.
GBP/USD is nudging higher but this week’s range is less than 150 pips, while the Average True Range (ATR) is at a multi-month low. The daily chart remains positive with cable trading above all three moving averages, while a break above yesterday’s 1.2362 high would see the pair back at highs last seen at the beginning of February. A bullish break higher will likely target 1.2448, while a cluster of recent highs and lows down to 1.2172 should provide support.
GBP/USD Daily Price Chart – March 30, 2023
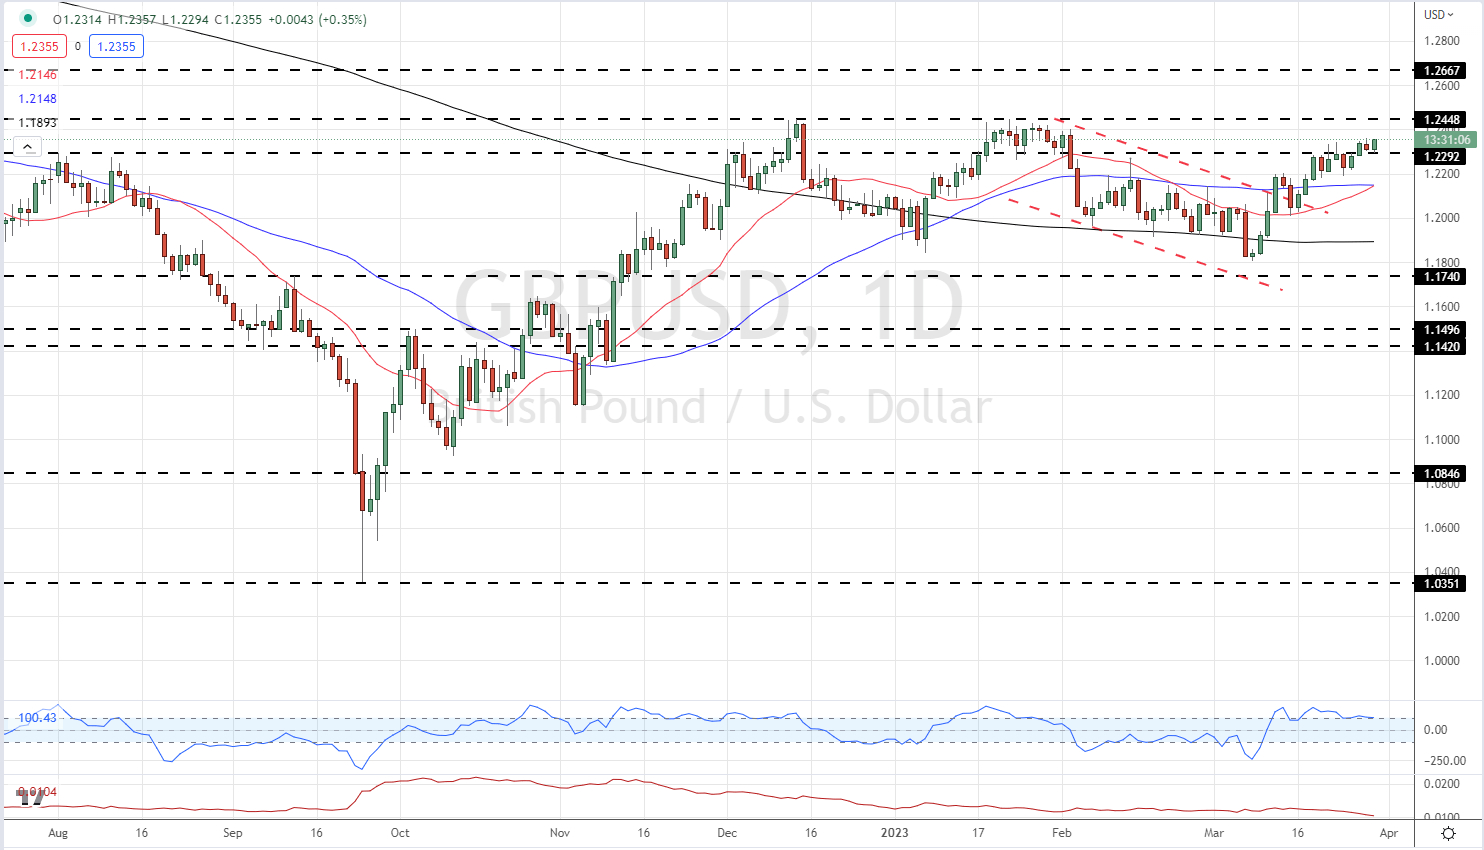
Chart via TradingView
| Change in | Longs | Shorts | OI |
| Daily | 3% | -7% | -3% |
| Weekly | 4% | -10% | -5% |
Retail Trader Data
Retail trader data show 40.46% of traders are net-long with the ratio of traders short to long at 1.47 to 1.The number of traders net-long is 2.14% higher than yesterday and 0.17% lower from last week, while the number of traders net-short is 9.12% lower than yesterday and 17.50% higher from last week.
We typically take a contrarian view to crowd sentiment, and the fact traders are net-short suggests GBP/USD prices may continue to rise. Positioning is less net-short than yesterday but more net-short from last week. The combination of current sentiment and recent changes gives us a further mixed GBP/USD trading bias.
What is your view on the GBP/USD – bullish or bearish?? You can let us know via the form at the end of this piece or you can contact the author via Twitter @nickcawley1.


