
GBP/USD and EUR/GBP Analysis and Charts
- UK inflation is expected to move lower again.
- Sterling volatility should increase mid-week as heavyweight data hits the screens.
For all market-moving economic data and events, see the DailyFX Calendar
FX markets have been moved around this week by the US dollar with the greenback weakening and strengthening on dovish Fed speak and higher-than-forecast headline inflation respectively. With little in the way of any heavyweight UK data, GBP/USD has traded in a 1.2165 to 1.2335 range over the past five days with the pair currently at the lower bound.
Download the Brand New Q4 British Pound Forecast

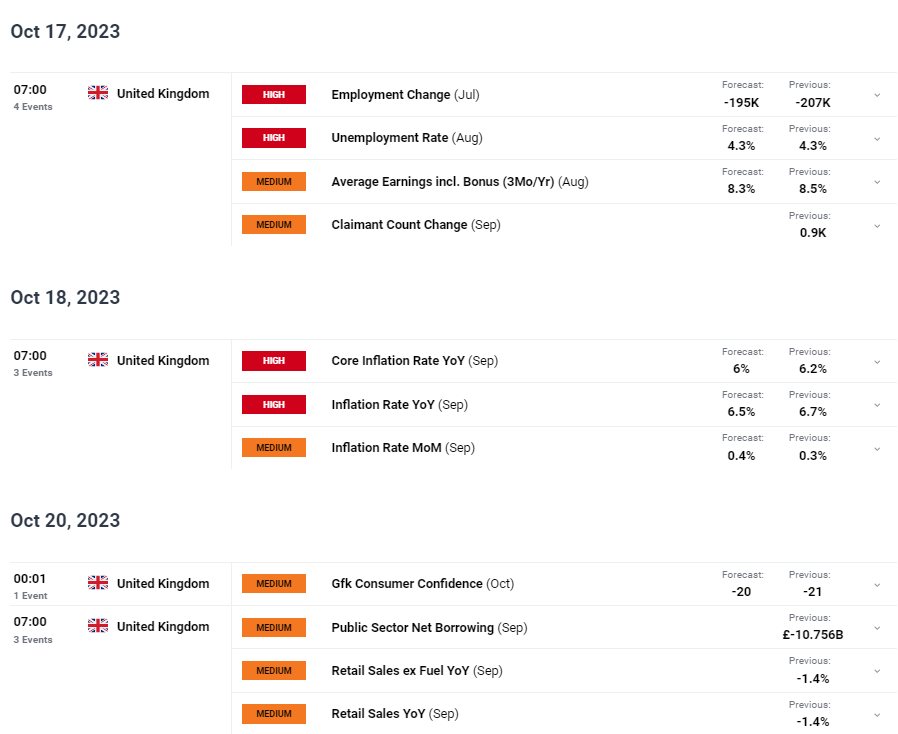
Next week the latest UK inflation data and Jobs report will be released. Core inflation is seen falling by 0.2% to 6% y/y while headline inflation is also seen two-tenths-of-a-percentage point lower at 6.5%. The UK jobs report is expected to show the unemployment rate steady at 4.2%, while average earnings inc bonus is expected to fall to 8.3% from 8.5%. UK retail sales round the week off on Friday. Any significant deviation from expectations in the jobs or inflation data will spark a reaction in Sterling-pairs.
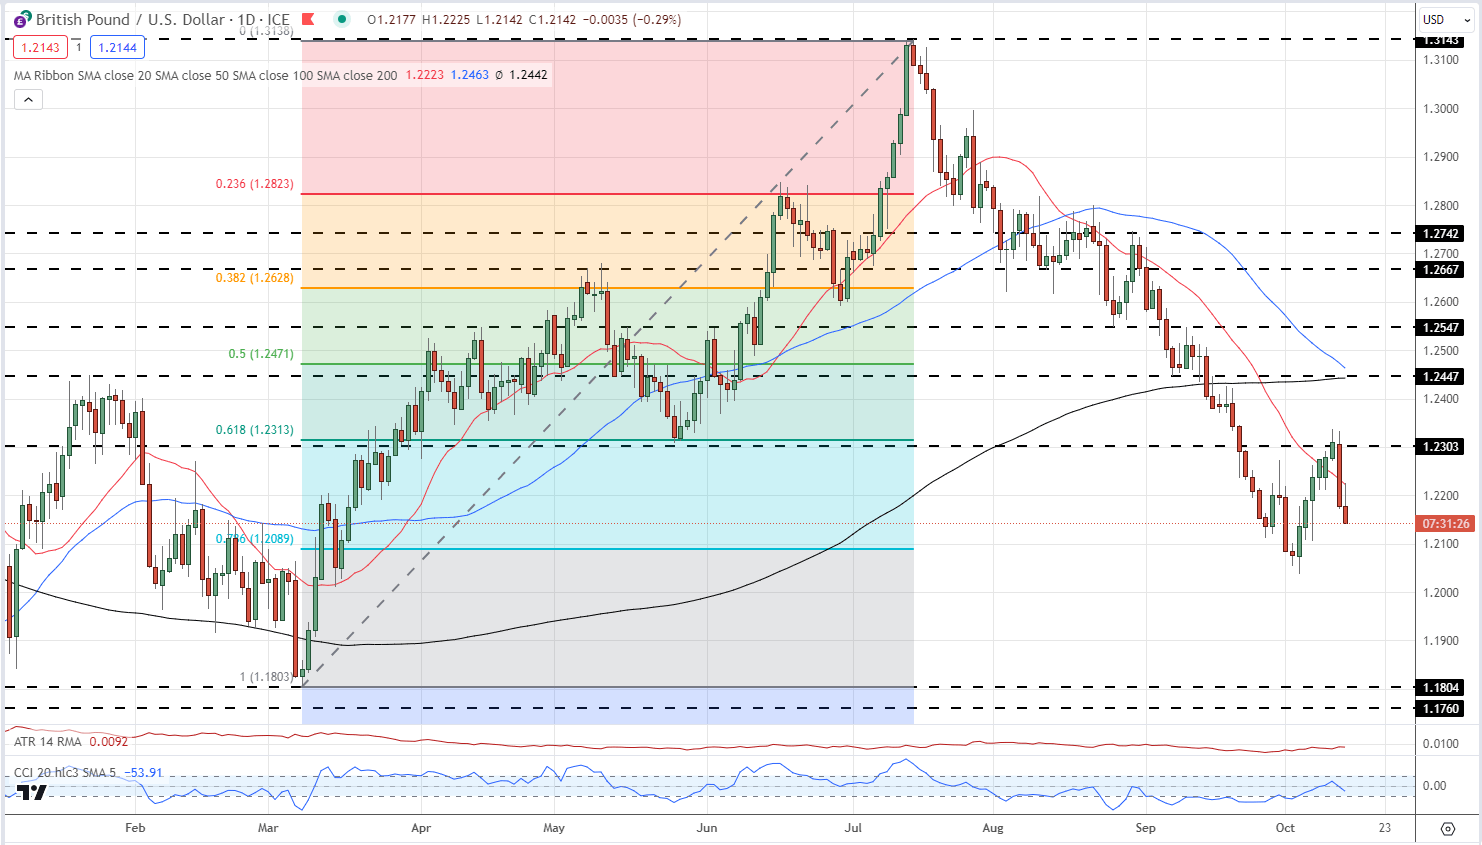
Cable is fading lower again going into the weekend and eyes the 78.6% Fibonacci retracement at 1.2089 ahead of last Wednesday’s multi-month low at 1.2038. Below here there is little in the way of any strong support before the March low at 1.1803 comes into focus.
GBP/USD Daily Price Chart
See How GBP/USD Traders are Currently Positioned
| Change in | Longs | Shorts | OI |
| Daily | 19% | -6% | 6% |
| Weekly | 6% | 0% | 3% |
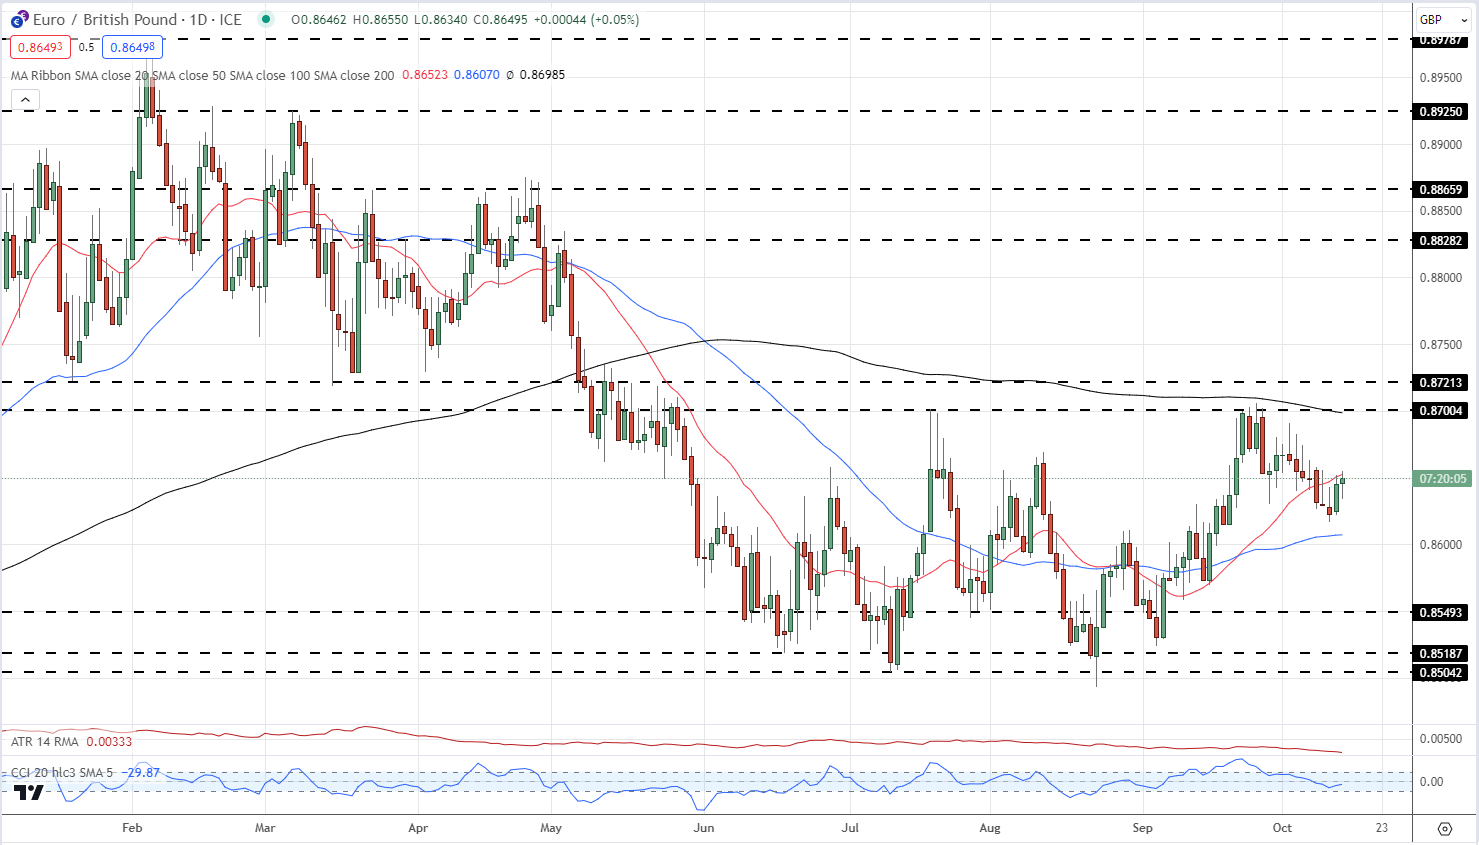
EUR/GBP remains in a multi-month range and is likely to remain contained in the weeks ahead. The recent uptrend after testing support in late August is now broken, while the 200-day sma continues to press down on the pair. A break below the 50-day sma, currently at 0.86070 would open the door to further losses.
EUR/GBP Daily Price Chart – October 13, 2023
Charts using TradingView
What is your view on the British Pound – bullish or bearish?? You can let us know via the form at the end of this piece or you can contact the author via Twitter @nickcawley1.