

Bitcoin (BTC/USD) Talking Points:
- Bitcoin trades sideways as technical levels of historical moves firm
- BTC/USD edges lower ahead of US inflation
- BTC, Ethereum (ETH) and Cardano (ADA) trade in the red – risk appetite sours

Bitcoin prices are currently trading between two big psychological levels (18,000 & 21,000), which have provided support and resistance for both short and longer term moves.
With risk sentiment and higher rates favoring the safe-haven US Dollar, BTC/USD is trading in a range-bound state as prices temporarily stabilize around 19,000. As the major cryptocurrency remains vulnerable to geopolitical risks, technical levels could provide an additional catalyst for price action.
Bitcoin (BTC/USD) Technical Analysis
From the perspective of the weekly chart, a strong decline from the November 2021 high of 69,000 fueled a strong sell-off that drove prices to a low of 17,592 in June. A rejection of this level and of the December 2020 low of 17,569 allowed BTC to rebound before running into another big level of Fibonacci resistance (March – June 2022 move) at 24,824.

Bitcoin (BTC/USD) Weekly Chart
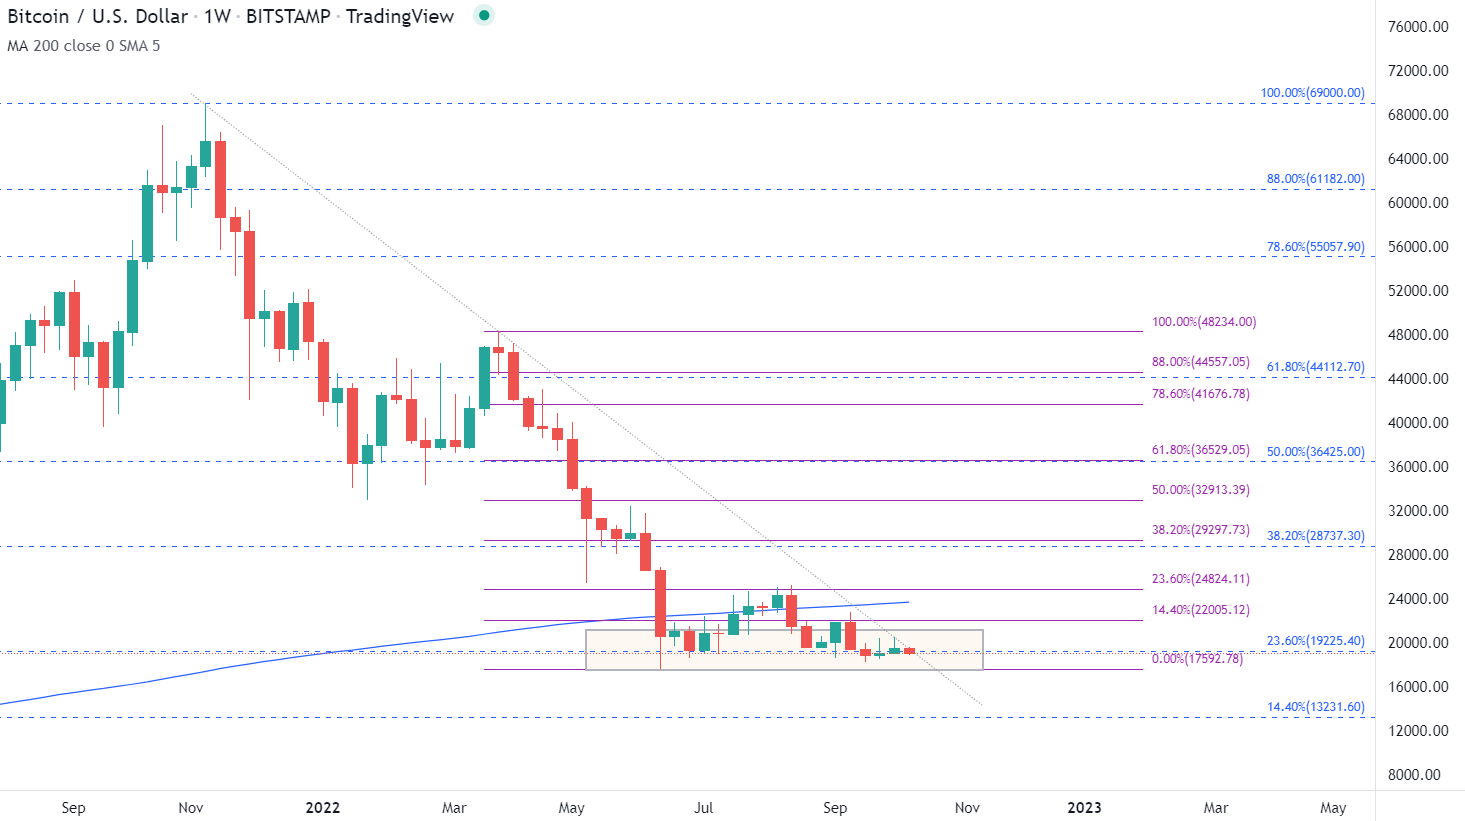
Chart prepared by Tammy Da Costa using TradingView
However, as selling pressure increased, a move back below the 200-week MA (moving average) allowed bears to drive price action back below the 23.6% retracement of the 2020 – 2021 move that continues to provide imminent resistance at around 19,225.
This zone of confluency is further highlighted on the daily chart. With trendline resistance from the November high holding firm, bulls will need to clear the 20,000 and the 22,000 handle before moving back toward 24,000.
Bitcoin (BTC/USD) Daily Chart
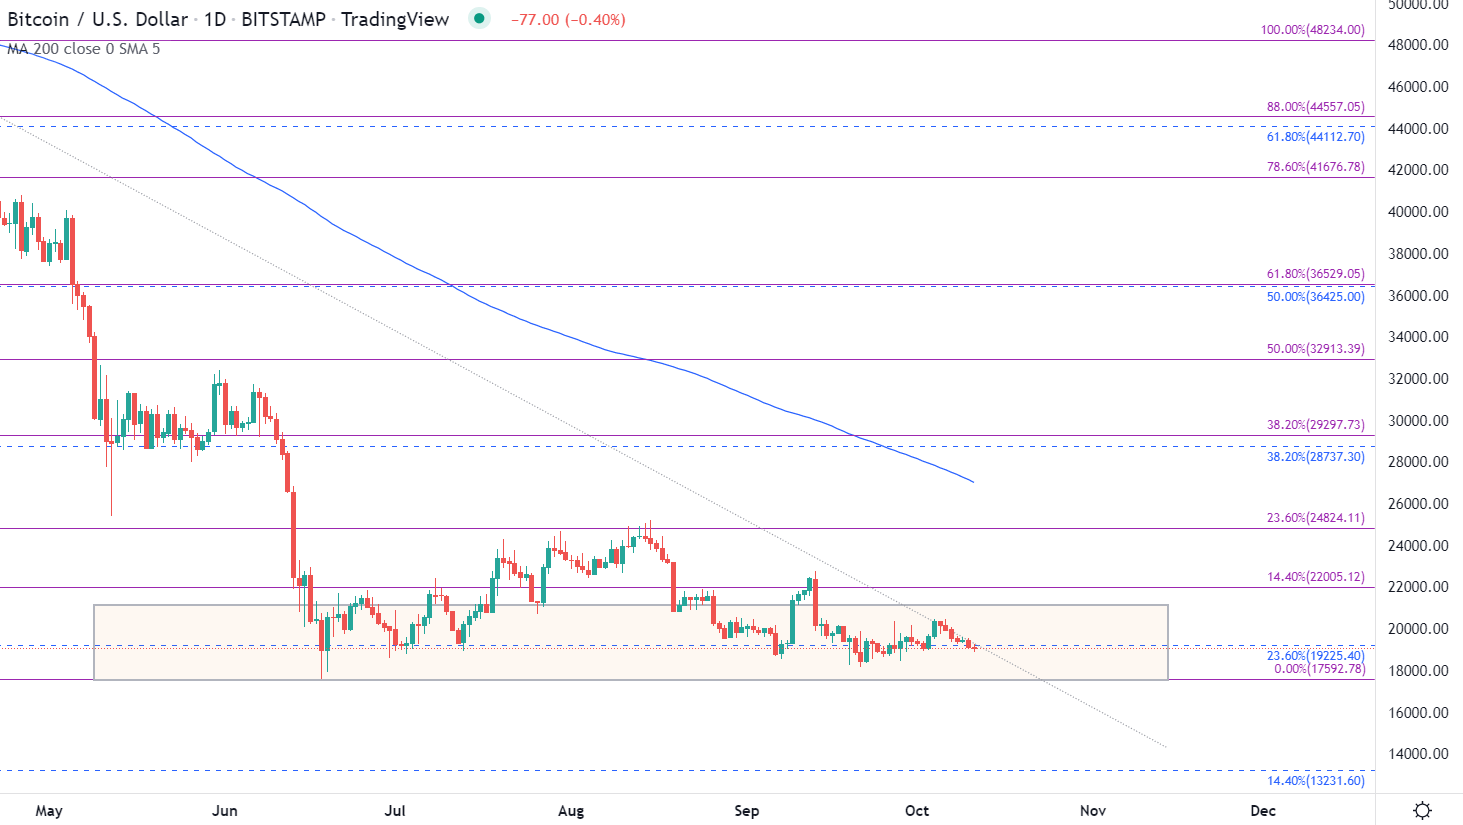
Chart prepared by Tammy Da Costa using TradingView
Meanwhile, a hold below 19,225 and 19,000 could allow bears to retest the June low at 17,592, opening the door for bearish continuation.
Bitcoin Further Reading:
- What is Bitcoin? Understanding Bitcoin as a Cryptocurrency
- New to Bitcoin? Read how to start trading cryptocurrency guide
- Learn how to day trade Bitcoin & other major crypto
--- Written by Tammy Da Costa, Analyst for DailyFX.com
Contact and follow Tammy on Twitter: @Tams707