Bitcoin (BTC) Prices, Charts, and Analysis:
- Lack of follow through after ETF-hope-inspired rally.
- Support coming pressure as traders wait for next week’s FOMC meeting.

The announcement in mid-June that BlackRock had put in an application with the SEC for a spot Bitcoin ETF sent crypto markets spiraling higher as investors bet that the fund titan would succeed where others had so far failed. A spot BTC ETF is seen as one of the best ways of spreading Bitcoin adoption to a wider investment audience. BlackRock CEO Larry Fink has been vocal since saying that interest in a Bitcoin ETF is broad-based and worldwide, telling CNBC that ‘as with any new market if BlackRock’s name is going to be on it, we’re going to make sure it’s safe and sound and protected’.
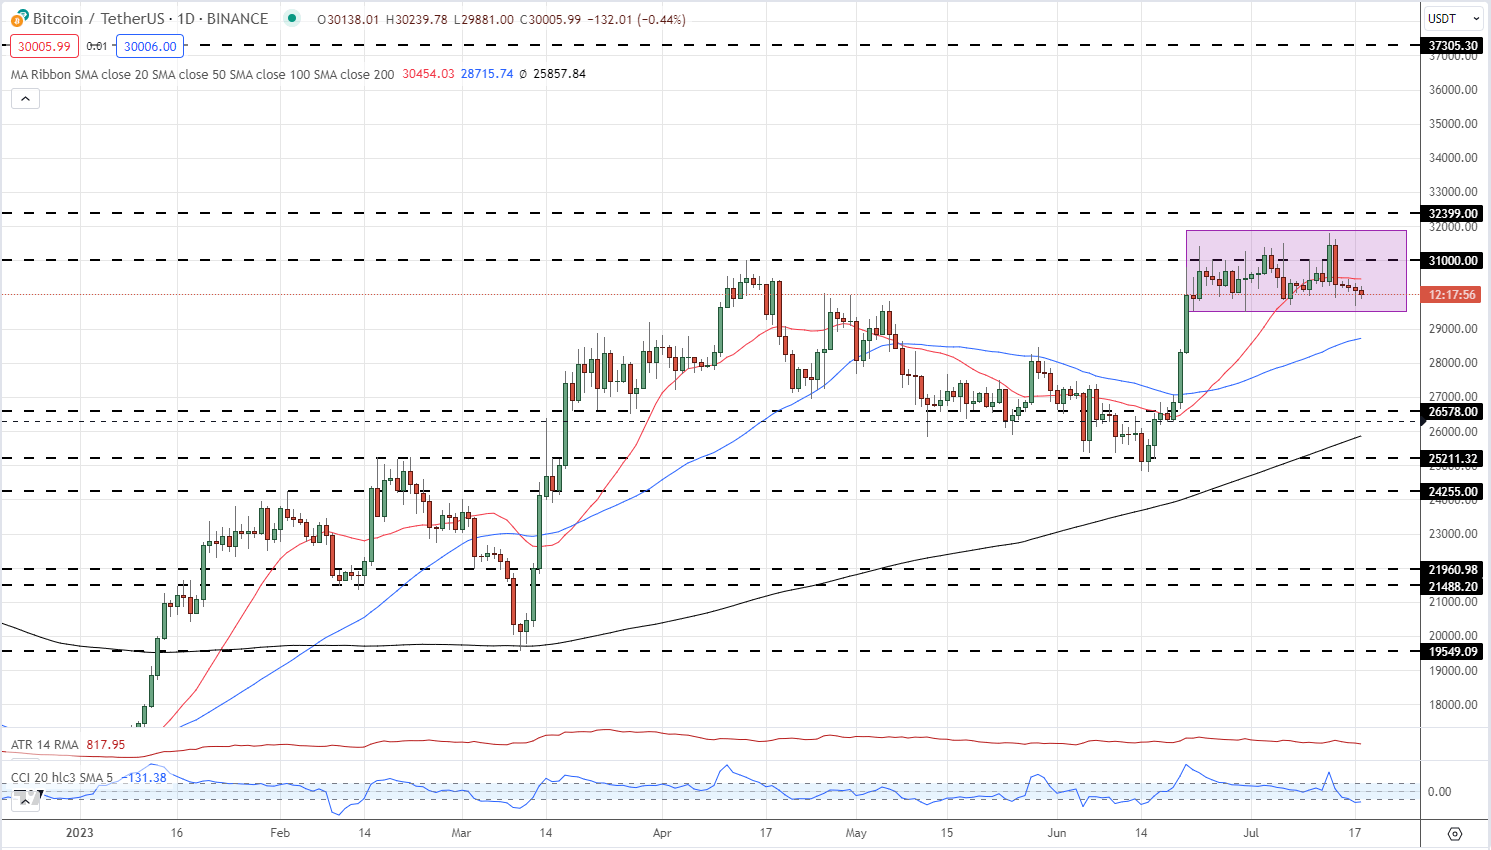
While BlackRock is making bullish noises, the price of Bitcoin post-announcement has been flat and range bound with only short-term bouts of volatility. Bitcoin has made a bullish flag formation, suggesting that prices will go markedly higher, but as yet BTC/USD has been unable to close and open above $31k, the April 14 swing high. Bitcoin is also back below the recently supportive 20-day simple moving average and is close to testing the recent $29,500 low made at the end of June. For Bitcoin to push higher it needs to make a confirmed break of $31k. If this plays out then $32.4k (May 2022 swing high) is the next level of resistance before $37.3k comes into play. A confirmed break of $29.5k leaves BTC/USD at risk of further losses. Next week’s FOMC policy decision – rates are expected to be pushed 25 basis points higher – is the likely catalyst for the next move in Bitcoin.
Introduction to Technical Analysis
Support and Resistance
Recommended by Nick Cawley
Bitcoin (BTC/USD) Daily Price Chart – July 18, 2023
What is your view on Bitcoin – bullish or bearish?? You can let us know via the form at the end of this piece or you can contact the author via Twitter @nickcawley1.