

Bitcoin (BTC) Charts and Analysis:
- Bitcoin’s sharp reversal on Thursday was impressive.
- Longer-term trend under increasing pressure.

The wait for Bitcoin’s next move is nearly over after weeks of sideways choppy trade. The largest crypto by market cap has been stuck below $20.5k for the last month while support around $18k-$18.3k has held firm. In common with other risk markets, Bitcoin had a wild ride post-US CPI, falling quickly to support before reversing sharply higher to tag $20k earlier today.
Last week we identified that Bitcoin was nearing the apex of the multi-month downtrend and medium-term support. This may break soon.
Bitcoin (BTC) Technical Outlook – Long-Term Downtrend Remains in Play
The daily BTCUSD chart is now showing a small break above the downtrend, triggered by yesterday’s rally. This break higher needs to be confirmed over the next couple of sessions to bring initial resistance at $20.5k into play. Above here, prior highs at $22.8k and $25.3k will draw attention.
While yesterday’s move higher may provide reasons for traders to be optimistic, a move back below the downtrend would very likely see Bitcoin break multi-week support and fall further. Bitcoin has been very quiet over the last few weeks and any break of support may see a sharp move lower as traders throw in the towel. Either way, expect Bitcoin volatility to increase in the days ahead.

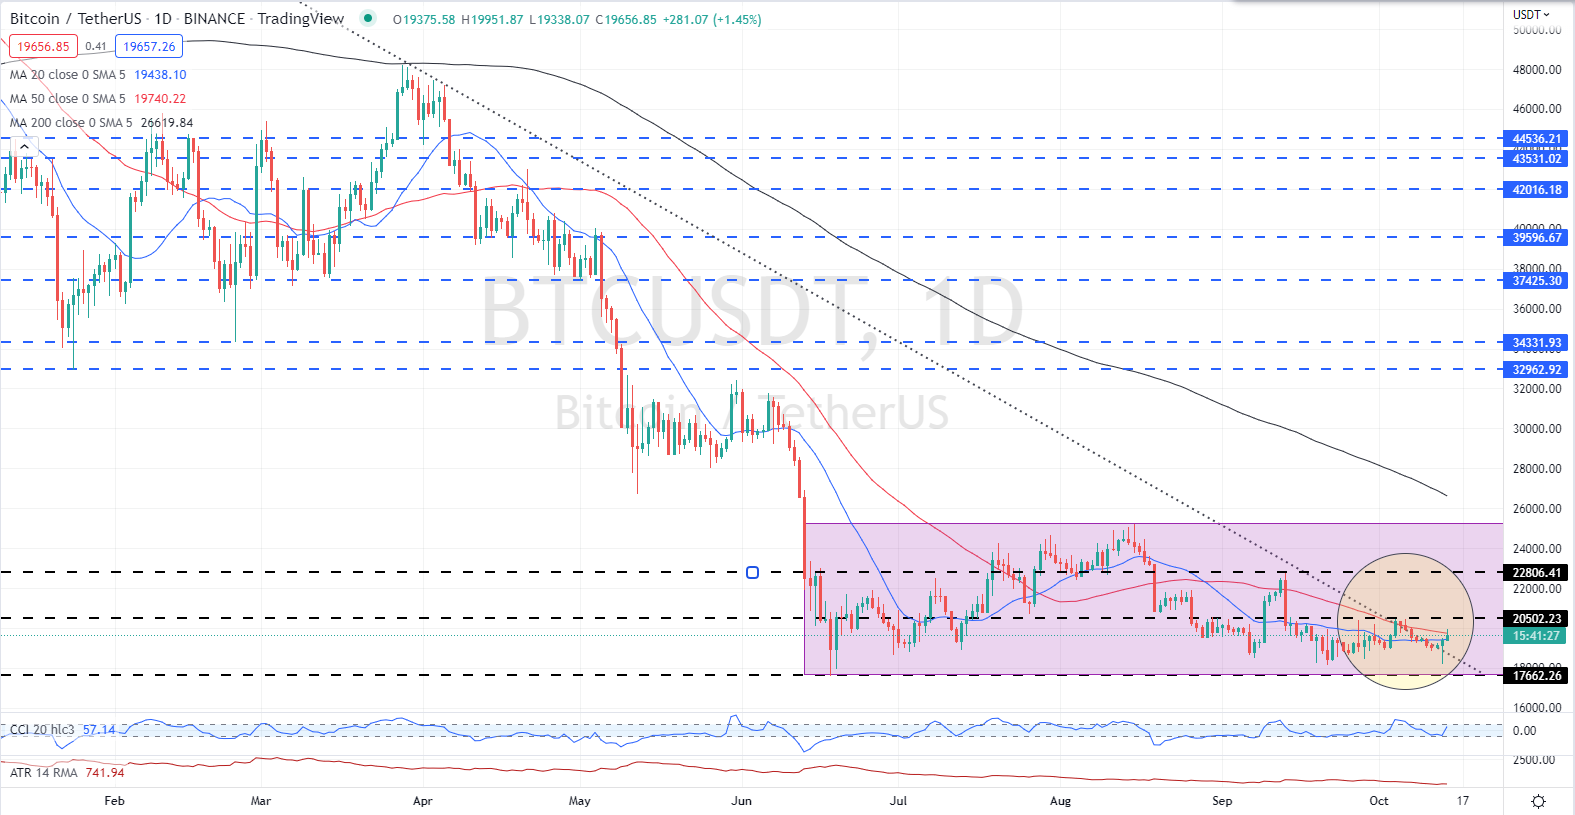
Chart via TradingView
What is your view on Bitcoin – bullish or bearish?? You can let us know via the form at the end of this piece or you can contact the author via Twitter @nickcawley1.